(713) 501-3336
Stroke Detection Device
Spring/Fall 2022
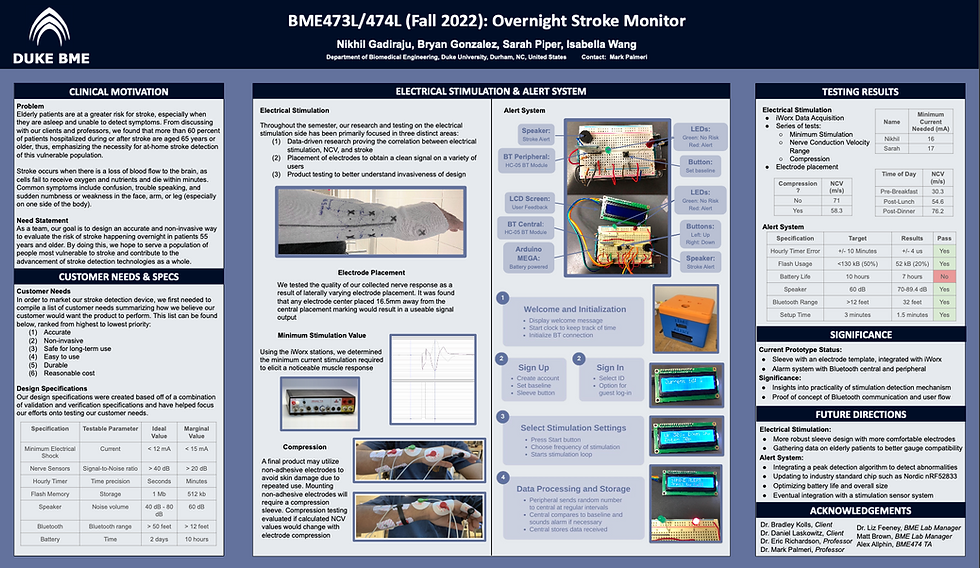
The goal of our project was to find an accurate and non-invasive way to evaluate the risk of stroke happening overnight in patients 55 years and older. Through our participation in the BME Design Fellows program at Duke, our team chose to enroll in both BME473L and BME474L in order to tackle this problem; these courses emerge students in a formal engineering design process working on design problems identified with Duke Medical Center clinicians and local medical technology companies.
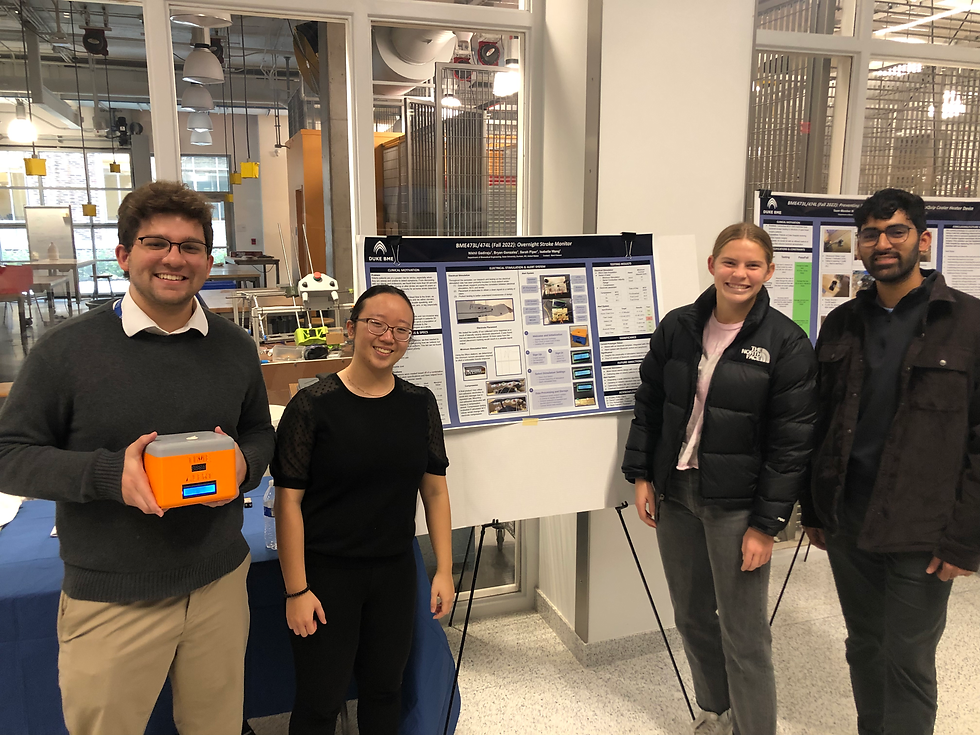
Special thanks to my BME473/474 team members for their constant drive to understand one another's perspectives and work towards a common goal! Our group, the Stroke Folks, included team members Bryan Gonzalez, Nikhil Gadiraju, Isabella Wang, and myself!
Clinical Need
Problem Statement
To this day, stroke remains the leading cause of long-term disabilities in adults worldwide with the World Health Organization (WHO) estimating that more than 50 million healthy persons across the world will lose their lives as a result of stroke in 2005 alone (Algahtani 2015). Of this number, approximately 14 percent of all strokes occur overnight, preventing many patients from receiving life-saving treatment in a reasonable amount of time (American Academy of Neurology 2011). To put a number to that percentage, this means that some 58,000 people in the United States are rushed into emergency hospital care with a wake-up stroke over the span of one year (American Academy of Neurology 2011).
Over the course of two semesters, our team has been working to find an accurate and non-invasive way to evaluate the risk of stroke happening overnight in patients 55 years or older. As stated, our solution has been targeting elderly stroke patients as this population is the largest and highest risk customer in this market today. This population is high-risk due to the elderly population’s older age, but also because of existing physical disabilities they may already have and social isolation that would impede timely transport and treatment if a stroke were to occur. For this reason, our team has chosen to evaluate elderly patients in the context of overnight treatment. In order to cater to this population, our product needs to be accurate, reliable, comfortable, and capable of storing relatively large amounts of data. It is imperative that our design meet these user needs in order for the product to save lives and find success in the healthcare market.
Societal, Cultural, and Global Impact
With our focus being on one of the most high-risk and vulnerable stroke populations, our product’s ability to enhance the lives of both our customer and his/her caregivers will be critical as we work to make a societal, cultural, and global impact on this market. In the context of the patients’ social/physiological state, many stroke patients become at risk for depression, anxiety, changes in identity, and social isolation due to a fluctuation in emotional, cognitive, and physical abilities after stroke; this can often be a result of the social stigma and marginalization that these stroke survivors must carry (Mukherjee 2006). Culturally, stroke is a life-changing event and the perception of this condition is found to vary worldwide (Alqahtani 2015). With medical professionals often knowledgeable about general information and treatment procedures for stroke, it is also crucial that the patient’s perceptions of this disability be taken into account. Unfortunately, this may be much easier said than done as medical professionals must focus first on providing the correct treatment to their patient. With our stroke detection monitor being accurate, reliable, and easy to use, the stroke survivor, caretaker, and medical professional will no longer need to rely so heavily on the patient’s uptake of medical information during such an overwhelming life change. In addition, since many of these devices have the ability to detect stroke within an hour of its occurrence, caretakers would benefit from more hours of sleep and a greater emotional capacity for everyday life. These impacts on stroke survivors are some of the most predominant effects on a patient’s state of mind, but stroke detection technology has the ability to lighten the loads of these survivors and their families for years to come.
Through the research and prototyping process of our nighttime stroke detection monitor, our team hopes to contribute to the global medical knowledge on stroke detection in an innovative way so that future product developers have a greater potential for successful outcomes. With or without a successful product today, the physiological research and overall contributions made in our design process will become a resource for future innovators and engineers on what has been done before.
Background
Biological Background
Stroke occurs when there is a loss of blood flow to the brain as brain cells cannot get the oxygen and nutrients they need from the blood and start to die within a few minutes. Happening in one of two ways, the loss of blood flow is either a result of clotting in the artery or a sudden rupture of the artery. An ischemic stroke occurs when a blood clot blocks the blood flow in an artery within the brain while a hemorrhagic stroke occurs when a blood vessel bursts within the brain (CDC 2022). Since the brain controls our movements, stores our memories, and is the source of our thoughts, emotions, and language, a person’s body is unable to complete many of its everyday functions during or after the onset of a stroke (CDC 2022). The brain also controls many functions of the body like breathing and digestion, therefore making stroke a life-threatening condition for many people. A third type of stroke is known as a transient ischemic attack (TIA) which is a temporary period of symptoms similar to those of a stroke, but only lasting a few minutes. Although a TIA often does not cause permanent damage, it may be a warning as one in three people who have a TIA will eventually have a stroke, with about half occurring within a year of the attack (CDC 2022).
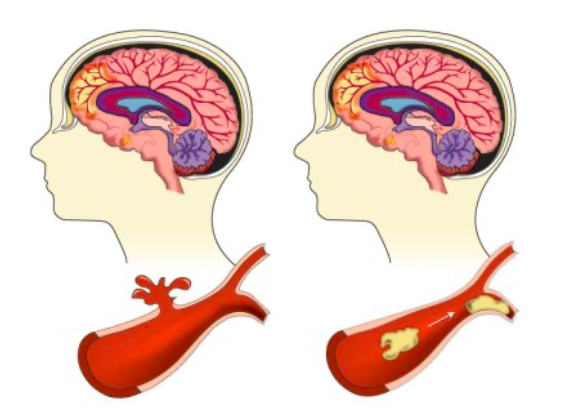
Figure 1. Diagram of a hemorrhagic (left) and ischemic (right) stroke (Lumen Learning 2022).
With this being said, if the back of the brain is damaged, one may have a disability involving his/her vision. If the left side is damaged, the right side of the body will be affected by paralysis, speech problems, slow behavior, and/or memory loss. If the right side is damaged, the left side of the body will be affected by paralysis, vision problems, quick behavior, and/or memory loss. If the brain stem is damaged, it may affect both sides and cause locked-in syndrome. As the variation in these symptoms indicate, damage to different sides of the brain elicit different symptoms; therefore, the location of this stroke event can often be determined by the symptoms the patient is experiencing.
Typical stroke symptoms are sudden numbness or weakness in the face, arm, or leg (especially on one side of the body), sudden confusion or trouble speaking, trouble seeing in one or both eyes, sudden dizziness, and a sudden severe headache with no known cause. Risk factors for stroke include high blood pressure, diabetes, heart diseases, smoking, increased age, high cholesterol, and family history of strokes.
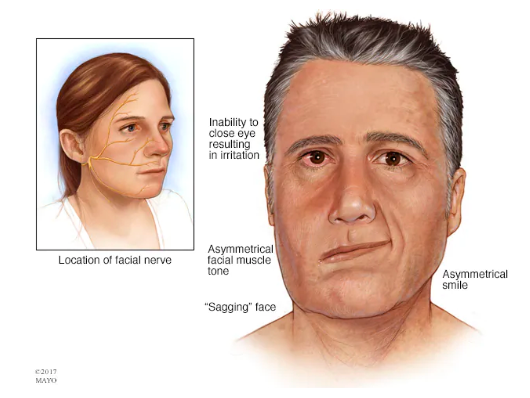
Figure 2. Visual showing stroke symptoms relative to the facial nerve.
Consumer Landscape
If our device were marketed to everyone, the majority of people using it would be 55 years or older as a person’s risk of stroke doubles every 10 years after age 55 (CDC 2022). In addition, African Americans, Hispanic Americans, and American Indian/Alaska Natives are at a greater risk than the white population and men are at a greater risk than women (NICHD 2022). These statistics are crucial to take into account as we work to make our product available to all people groups.
As we look forward towards marketing and distributing our product to consumers, it is also important that we look into the mechanism from which this distribution would occur. Based on existing devices, the customer will most likely gain access from a healthcare professional at a hospital who has provided their treatment plan and is monitoring their health. Due to this, it would be up to the physician if this product were to be recommended. In addition, we envision medical device companies and medical journals to be interested in promoting or improving on our device design; this would greatly expand our business model and allow for it to reach a greater market size. Hospitals with specialized stroke centers are also more likely to be open to using our promoting our stroke detection monitor.
Existing Solutions
The most prominent device that addresses stroke detection on the market today is the Zeit medical device, a nighttime wearable headband that reads EKG signals to recognize the onset of a potential stroke. The device utilized AI technology to read EEG signals throughout the night and identify abnormalities that may be representative of a potential stroke. A second wearable device aimed at detecting strokes is the volumetric impedance phase-shift spectroscopy (VIPS) technology, a portable visor system developed by a medical device company. The rationale behind the VIPS device, known as the Cerebrotech VisorSystem, is that bioimpedance data reflects small changes in the brain’s electrical properties over volume which can be used to provide information about fluid changes in the brain. Although this technology is primarily for use in the hospital setting and not for personal nighttime detection, it is still a key competitor in regards to design. Lastly, many devices on the market are simply an alert system, but do not have independent detection capabilities and rely on the user to click a button in order to receive help. Although these are not in direct competition with our product, they do solve the same problem, just at a more elementary level.
Current technologies being used in products of this kind are VIPS (referred to above), key blood marker detection, EEG, and heart rhythm detection. Other technologies that could solve the problem, but may be difficult to implement are magnetic resonance imaging (MRI), electrical impedance tomography (EIT), and computed tomography (CT).
As of right now, there is not a lot of competition addressing the specific problem we are aiming to solve. Although the aforementioned Zeit medical device is a prominent competitor, the primary issue is that it is adaptable specifically to older adults, but cannot be applied to younger populations. Ideally, a product with improved adaptability is necessary to help those populations that aren’t reached through the current medical devices on the market today.
Market Analysis
In order to analyze the market for a stroke detection device, our team put together data for potential market segments, estimated market size, competitive products, and total addressable market. Rationale and estimated values for many of these categories can be found in the chart below.
Our main three potential market segments were children who suffer from secondary pediatric strokes, people 55 years or older at risk of having a stroke, and researchers studying stroke mechanisms and treatment; these potential market segments were then broken down into the categories above.
The estimated market size of children suffering from secondary pediatric strokes is around 8,000 children aged 1-18 years old. Our team believes this to be true as 72.8 million children in this age range are affected annually by this condition (US data as of 2020). A few competitive products on the market for this population would be Hydroxyurea and transfusion therapy. Our team estimates that parents with a child at risk of a stroke recurrence would be willing to pay around $300 a year for a monitoring device, but of course, this value would be highly variable in reality; this estimation comes from the understanding that current stroke technology ranges from $100 to $500, with an average of $300. Consolidating this information, the total addressable market for children suffering from secondary pediatric strokes would be $2,400,000/year ($300 * 8,000 children).
The estimated market size of people 55 years and older at risk of having a stroke is around 85 million adults; this estimation is based on the fact that around 75% of US strokes occur in those 65 years and older as well as there being around 85 million US adults close to this age range. There are a few competitive products on the market for this market segment including the Zeit headband (referred to above). Our team estimates that adults at risk would be willing to pay around $300 for a monitoring device since current stroke monitoring technology ranges anywhere from $100 to $500. The total addressable market for adults 55 years or older at risk of a stroke would be 25,500,000,000/year ($300*85 million adults).
Lastly, the estimated market size of researchers studying stroke mechanisms and treatments is around 630 project teams; this is based off data that NIH reported stating there were about 9000 projects per year that received funding to do stroke research and that 70% of these teams would be willing to try our product. Competitive products for this market segment may be clinical trial devices, simple electrodes, and general wearable devices. Knowing that each team spends around $450,000/year, we would assume that 0.1% of that funding goes to these devices. The total addressable market for researchers studying stroke mechanisms and treatments would be $850,000,000/year ($300 * $4,500/year * 630 research teams).
After completing our market analysis research and speaking with our client, our team decided to focus on secondary stroke prevention in adults aged 55 years and above.
Customer Needs
After team discussion and conversations with our client, the customer needs for our prototype were broken up into user needs, payer needs, and regulatory/standards needs. Each of these needs were ranked within their respective sections and will serve as a foundation for idea formation in the future.
Table 1. Customer needs chart.
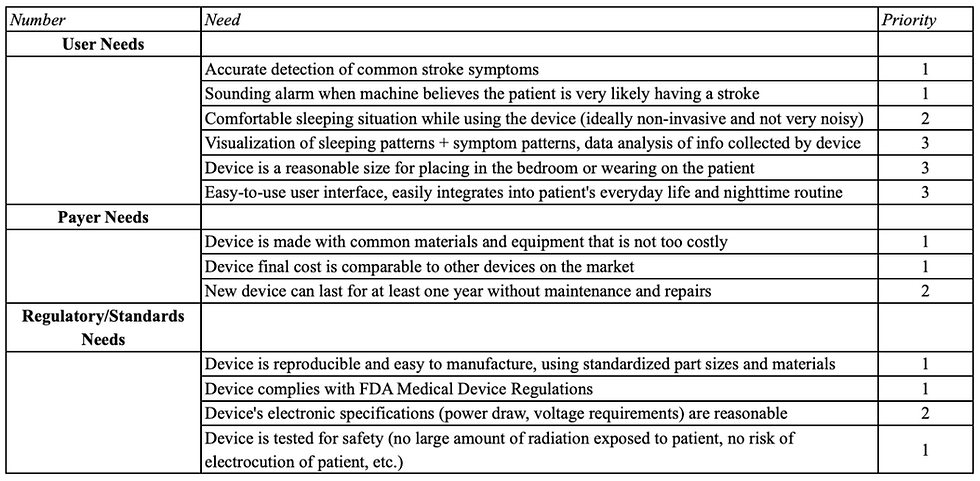
After considering the circumstances that would result in a patient’s use of our device, carefully analyzing our consumer market, and predicting our users’ most important needs, we narrowed down six customer requirements for our device in order of priority; these needs can be seen below and are integrated into our validation specifications in Table 2.
Accurate
Non-invasive
Safe for long-term use
Easy to use
Durable
Reasonable cost
Specifications
Over the course of this project, we’ve adhered to a well-defined product development process; this engineering process includes weekly team scrums alongside continuous Verification and Validation (V&V) metrics. Verification concerns evaluate whether product design outputs align with quantifiable, defined design inputs while validation refers to evaluating whether a final product satisfies the initial user needs set prior to product deployment. As a part of this development pathway, both V&V specifications need to be defined, with validation specifications being specifically mapped to user needs.
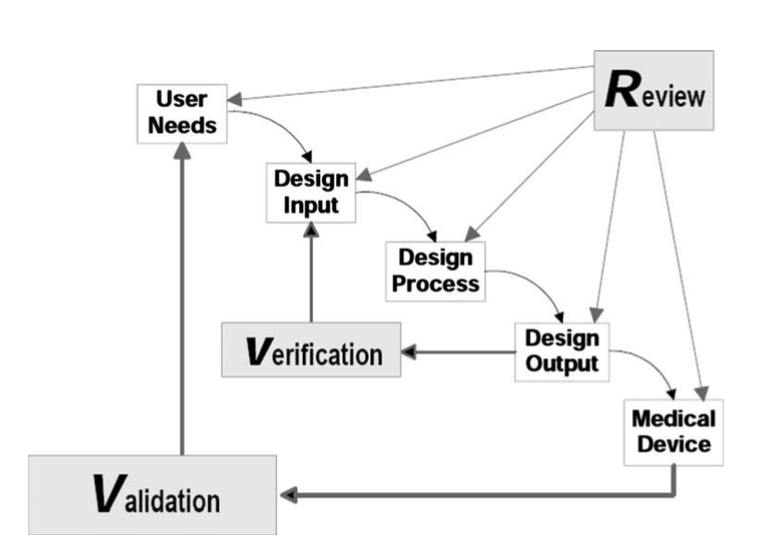
Figure 3. Role of V&V in the product development process.
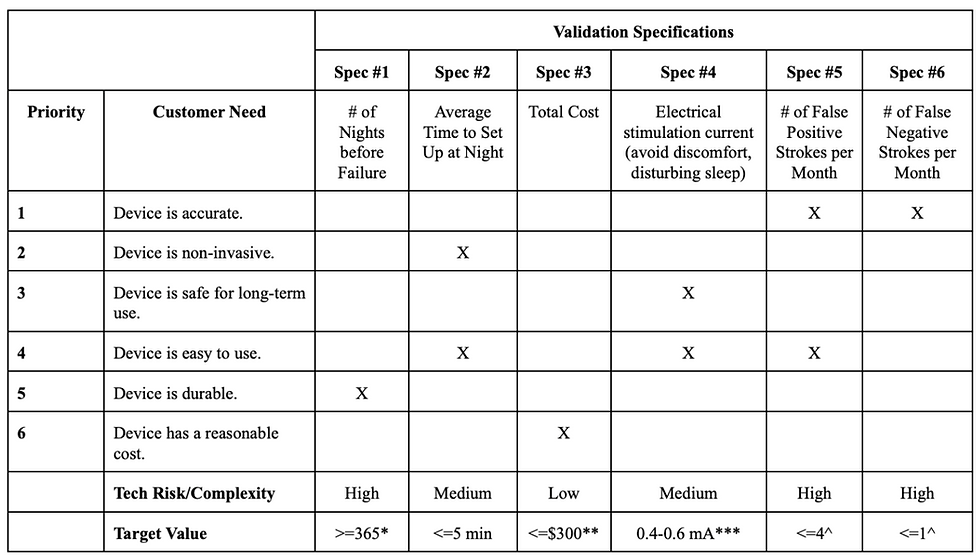
Our validation specifications are specifically outlined in Table 1 alongside target values that will be utilized during validation activities. Furthermore, these specifications have been mapped to a set of customer needs; mapping our specifications to customer needs provides an impetus for ensuring successful validation throughout product development. Our validation specifications, as seen in Table 2 are the number of nights before failure, average time to set up at night, total cost, electrical stimulation current, number of false positives per month, and number of false negatives per month (from left to right).
Testing of the electrical stimulation current can be found in the testing section under Minimum Stimulation Testing. The other five validation specifications were unable to be tested in our design as we did not reach a point of full integration with the alert system. Our customer needs can be found in the second column of Table 1 and include device accuracy, non-invasiveness, safety, ease of use, durability, and cost; these customer needs were ranked from highest to lowest priority. In addition to these specifications and user needs, our team worked to define the complexity of each specification as well as a target value that we could work towards during the design process.
Table 2. Validation specifications chart.
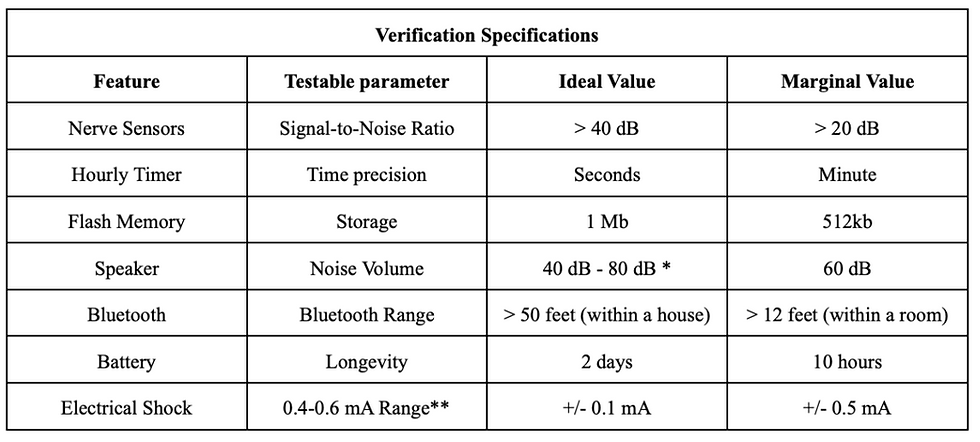
Verification specifications have been defined by mapping product features to testable parameters; these parameters have been assigned both ideal and marginal values to be utilized when verifying product performance (Table 2). As can be seen in the table below, the features our team chose to evaluate as our verification specifications were the nerve sensors, hourly timer, flash memory, speaker, Bluetooth, battery, and electrical stimulation. The testable parameter is included in order to define what will be tested in regards to that feature and the ideal value with a margin of error gives our team a target to work towards during the design process.
Table 3. Verification specifications chart.
Final Design
Our team’s design relies on the use of a nerve conduction velocity (NCV) test in order to assess a patient’s nervous system health. An NCV test measures the speed of electrical impulses as they move through the nerves. This measurement is often taken by medical professionals at a hospital in order to treat numbness, tingling, or continuous pain with no cause. Since nerve damage of this kind stems from the brain and looks to be similar to that of stroke symptoms, our team decided that the use of a portable, easy to use NCV test could be an innovative design for the detection of stroke. Although not all nerve damage is the same, we believe this could be a novel idea in the context of at-home medicine.
With a common stroke symptom being the sudden numbness or weakness in the arm, our design rests on the idea that an individual’s NCV in the arm experiencing numbness would be drastically lower than that of its baseline value; there is no comparison of the right arm to the left arm even though the device should be worn on both arms. For this distinction to be made, our stroke detection monitor would collect NCV data over a period of one week each night the individual puts the device on at night. Measurements such as time of day and NCV value would be taken throughout the night and correlated to one another in order to create a user baseline for the patient using the nighttime monitor. These measurements would ideally be taken every hour by sending a stimulation current through a portable electrical stimulation unit and receiving the voltage response given off thereafter. The NCV of the individual can be analyzed and calculated via peak detection technology and Python code through a series of variables and NCV equations. The primary equation used to calculate NCV is shown below where Dpd refers to the distance between the proximal stimulating electrode and detection electrode, Tp refers to the mean proximal conduction time, and Td refers to the mean distal conduction time.
NCV = Dpd(Tp-Td)
With a range of baseline data, the alert system will sound if the NCV value detected is largely outside of the range with more emphasis being on NCVs lower than the individual’s range. Note, our device is not meant to alert anyone in its first week of use and could trigger a false positive in the first month of use while the individual’s baseline is still being calibrated.
The implementation of our design can be seen in two parts at the moment, but ideally, would be able to integrate with one another in future design iterations. The two parts to our final design are the electrode sleeve and the alert system (including electrical stimulation unit). A visual of our ideal design can be seen below in Figure 4.
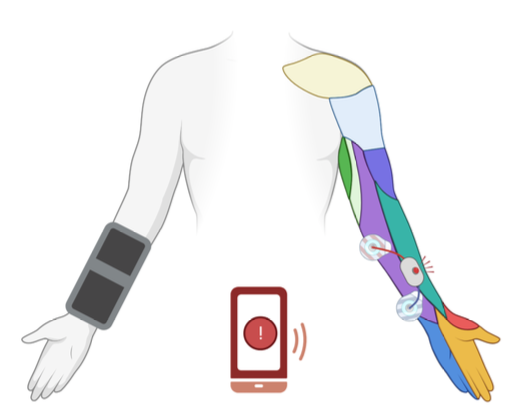
Figure 4. Ideal integrated design with electrode sleeve, stimulation system, and alert system.
The role of the alert system is to create a user-friendly interface that allows a patient to have its data collected, and be alerted in case of any emergencies. As mentioned above, the whole system is composed of three nodes: two in each arm and one that is the external processing unit, which can be a phone and/or a digital alarm clock. In our current prototype, we made a digital alarm clock. Its main goal is to collect key indicators from the arm node, compare them to the baseline and alert if needed. Those key indicators, for now, are just random numbers generated in the arm node. However, the final product would send the peak value and the peak's steepness. This can be calculated by checking a group of values before and after, and seeing how much it falls over time.
Besides this basic functionality, we also added the creation of profiles. As mentioned above, the baseline is improved and optimized over time. However, it would be hard to collect all of this data and store it locally if the device is turned off after use - which would be ideal to save battery life. Therefore, we are implementing the use of the electrically erasable programmable read-only memory (EEPROM) of the arduino, which stores data even after the Arduino is turned off. In order to organize this, we are creating profiles/userIDs. Each profile will take the nth size of the total profile struct (composed of 3 int variables) in the EEPROM depending on the userID. The profile with ID equals to 1, takes the first chunk, the profile with ID 2 takes the second, etc. The software GitHub is located at: https://github.com/isabellawwang/StrokeFolks.
In order to interact with this system, we created a circuit composed of three buttons and 2 LEDS as shown below. On the arm node, we also have 2 LEDS, but only a button. This button represents the user setting a baseline. For our prototype, that just sends a random number back to the alarm clock.
The role of the electrode sleeve is to specify where we would ideally integrate the electrodes for permanent use as well as a reference line for the user to verify placement relative to his/her own personal physiology. The horizontal line is meant to be placed on the center of the ulna bone in order to verify correct placement of the stimulating electrodes around the ulnar nerve.
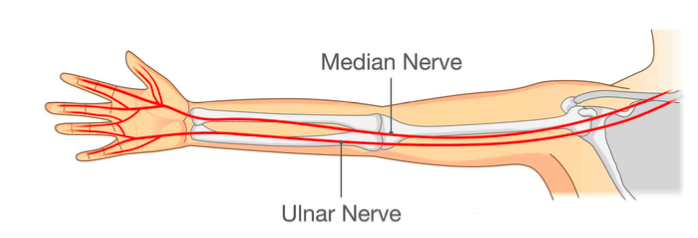
Figure 10. Diagram of ulnar nerve as it relates to electrode placement.
All X’s on the template mark where an electrode would be located in the final integrated product, per the BME244L nerve conduction lab manual. The sleeve is to be worn on both the right and left arms since numbness tends to occur in one or the other, but there is no comparison made between the two in our design technology.
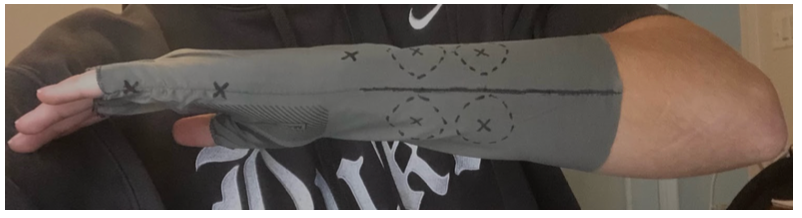
Figure 11. Electrode sleeve template.
In future designs, our team would like to look into the use of a simpler NCV set-up that uses less electrodes in order to aid in ease-of-use for our target population. In terms of the alert system, there are many ways that we could improve our device in future iterations, including:
Using an industry standard chip with a lower power draw, such as the Nordic nRF52833
Prompting calls to the patient and loved ones
A more refined enclosure that is more user-friendly and aesthetically pleasing, potentially made with acrylic or wood instead of 3D printing filament.
Integration of a patient monitoring app to receive and display patient data
Elevating circuitry to a PCB board or a proto shield for easy manufacturing and reproducibility
Testing to Specifications
Electrical Stimulation
When testing the electrical stimulation component of our design, our team’s main focus was on mitigating major concerns in variability and comfortability in order to diminish any concerns in the design process. We chose to focus on both of these user needs as, if testing of these needs were to fail, it would be difficult for our product to find success in the market. Many of these tests were crucial first steps to confirm the viability of our prototype design and can be iterated off of in the future to refine our understanding of the physiology governing stroke as well as the role electrical stimulation and nerve conduction velocities have the ability to play in the detection of stroke.
Divided by user need, the testing done on electrode placement was completed to assess our product’s performance in user variability while the testing for minimum stimulation and compression were to assess user comfortability. In addition, NCV range testing was completed in order to assess an individual’s variability throughout the day as it relates to signaling an accurate alert system. All four of these tests were completed to gain a better understanding of how our design could potentially operate, but an actual arm sleeve with integrated stimulating electrodes was never specifically tested.
Minimum Stimulation Testing
With comfortability being high on our list of user needs, the minimum stimulation necessary for the device to receive a large enough signal to accurately assess NCV can vary from person to person. Similarly, the maximum stimulation tolerated can vary from person to person. If the current is too low, an NCV would not be recorded and the device would be unable to detect stroke; this is because without a large enough response (voltage), there is no way for the peak detection algorithm to compare the distal nerve conduction time to the proximal nerve conduction time. If the current is too high, the user may wake up, have a hard time falling asleep, or experience too much pain/uncomfortability to continue using the product. After all, it is the user’s choice to put our product on before bed. Our goal is to make this less of a question and more of a habit each night. Due to the variability of human physiology and pain tolerance levels, it was imperative to first begin our testing process by evaluating a typical range of current that our device would need to stay within.
By utilizing the nerve conduction lab set-up from Duke University’s BME244L, our team was able to obtain data on nerve conduction times, response voltages, and the electrical stimulation necessary to receive an electrical response. Figure __ shows the electrode and probe placement for each location on the arm, as stated in the BME244L lab manual.
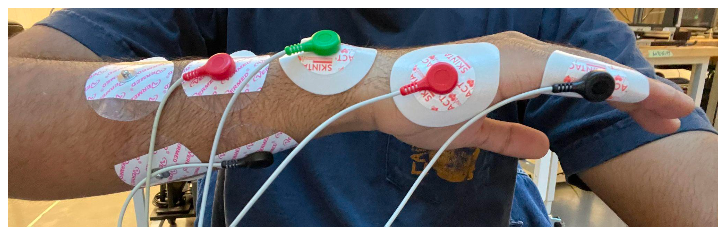
Figure 12. Electrode and probe placement for nerve conduction testing.
In this 7-electrode system, there are three different types of probes including those sending current, a ground, and those receiving current. The black and red electrodes on the left in Figure 12 are the probes sending current while the black and red electrodes on the right are the probes receiving current. The green probe on the wrist bone is the ground. In addition, there are two different types of electrodes that were used in this test. The Vermed gel electrodes are the four used on the left in Figure 12 while the Skintact adhesive electrodes are the three used on the right. The distinction between the gel and adhesive electrodes were made in order to aid in comfortability as the adhesive electrodes are much more difficult to remove than the gel electrodes and can cause pain for people with hairy arms.
Nerve conduction velocity is measured from the distal or proximal stimulation electrodes to the detecting electrodes found on the hand. For this to occur, an electrical current is sent to the body via the distal or proximal stimulation electrodes and an accompanying voltage is picked up by the detecting electrodes. For reference, the proximal stimulation electrodes are those closest to the heart (further from the hand) while the distal stimulation electrodes are those furthest from the heart (closer to the hand). The distances between electrodes was kept fairly uniform between participants, but was not exact; placement was largely based off of physiology in our early testing. A signal response, as can be seen in the iWorx software, is shown in Figure 13 with the voltage response on top and pulse of stimulating current on the bottom.
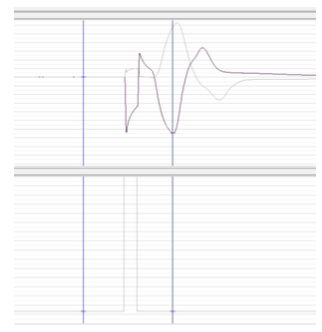
Figure 13. iWorx data for electrical stimulation (bottom) and voltage response (top).
Although we did obtain NCVs for both participants that completed this test, the purpose of the test was to compare the electrical current necessary to elicit a large enough response. Our team decided on a voltage response of at least 2 mV as a large enough response as this was a value at which we started to see a more defined bump in the response curve. Responses that were less than 2 mV did not seem to have a defined peak and we believe the peak detection algorithm would have a hard time making this distinction as well. With this being said, the minimum current for each individual was found to be where the participant’s voltage response peak was above 2 mV. This value was recorded for the proximal stimulation electrode only as the distal stimulation electrode will always require a smaller current than the proximal due its decreased distance from the detecting electrodes. The data for this test can be seen in Appendix A with the key results being summarized in Table 4, below.
Table 4. Results of minimum stimulation testing.

These results tell us that, although the minimum current for each participant was able to be reached with the iWorx TA software, the minimum current necessary varies greatly from person to person . In our verification specifications, our group chose 12 mA with a marginal value of +/- 3 mA as the ideal electrical shock strength, but one of the participants’ minimum current greatly exceeded this strength while the other was within the range. Although one was in the range, it is to be noted that it was oftentimes much higher (closer to 16 mA) in later testing. We would like to refine this test further in the future as electrode placement and distances from one another has the potential to decrease the stimulation current necessary, thus aiding in overall user comfortability.
NCV Range Testing
With accuracy being a necessary component in the detection of stroke, it is important that we understand the variability of NCV values for one person as a day progresses. This variability is important in order to assess whether NCV is a viable metric for use in our design as well as to better understand the general behavior of NCV throughout the day. During the design process, our team had been advised that a person’s NCV can be highly dependent on a variety of factors such as blood glucose, potassium, and hydration levels, factors that often fluctuate throughout the day.
In order to test this theory, the NCV of one participant was taken in the morning, early afternoon, and night with the first data set taken before breakfast, the second taken after lunch, and the third taken after dinner. The timing of these tests were primarily chosen in order to take into account blood glucose levels in the body. For example, the test performed in the morning was meant to analyze the body’s nerve response with low glucose and hydration levels while the test at night was meant to analyze the body nerve response with high glucose and hydration levels. Our prediction was that the test in the early afternoon would be somewhere in between that of the morning and night, but would likely fluctuate based on variable factors throughout the day.
All three tests were set up on the right arm and electrode placement was marked with a sharpie in order to keep consistent although different electrodes were used for each of the three times. The same test was performed each of the three times during the day with the same stimulation current (17 mA). The data for this test can be seen in Appendix A with the key results being summarized in Table 5, below.
Table 5. Results of NCV range testing.
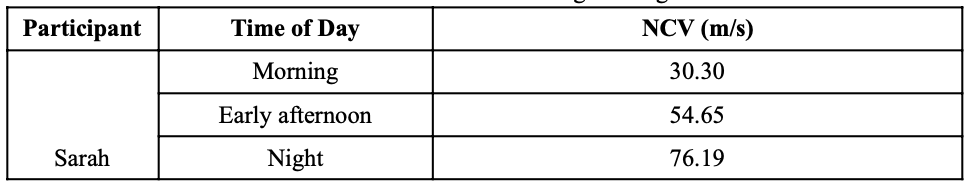
Results from this test were clear and what our team expected. Taking into account both glucose and hydration levels in regards to daily meals, we hypothesized that NCV would be lower in the morning and higher in the evening. Our product would utilize this data by creating a range of user NCV, personalized to the individual, able to store up to a month’s worth of information and create a baseline NCV range from this data. The individual’s NCV range would be on the higher end when the user puts the device on at night and, ideally, would slowly decrease as the night progresses into morning. The goal of our device would be to alert a caregiver if the patient’s NCV is drastically outside of his/her baseline range or far from his/her base trend line. The next steps in better understanding the practicality of NCV for stroke detection would be for one individual to complete this same series of three tests on multiple different days; this would provide the potential for necessary statistical analysis able to inform the consistency of NCV data as a whole. The number of participants could also increase to show variability between different people.
Compression Testing
Future project goals involve transitioning from adhesive electrodes to non-adhesive, carbon conductive electrodes to minimize potential long-term skin damage and irritation. Mounting non-adhesive electrodes requires a compressive force around the forearm, which might impact expected NCV readings. Thus, the expected change in NCV following downstream conversion from adhesive to non-adhesive electrodes must be evaluated. Furthermore, quantifying these expected changes will allow our device to calibrate to a more accurate range of NCV variability impacting the final device classification of stroke presence.
To evaluate compression, a velcro band was utilized around both the distal and proximal electrodes (Figure 14b/c) on the right arm. Initially, the uncompressed electrode setup was utilized to evaluate the standard NCV reading (reported at 71 m/s in Table 6, below). When subsequently activating both the proximal and distal stimulating electrodes, a velcro compression band was utilized to stimulate the compressive forces of a compressive sleeve (Figure b/c). Both distal and proximal nerve responses were collected and NCV was calculated.
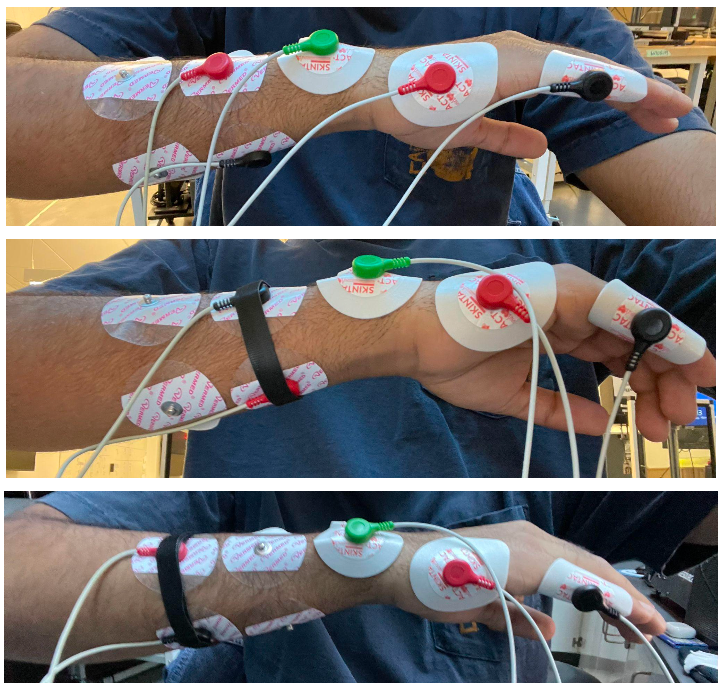
Figure 14a-c. Uncompressed electrode setup (a), proximal electrode compression setup (b), and distal electrode compression setup (c).
Table 6. Results of compression testing.

Within the evaluated subject, a noticeable drop in collected NCV value was observed. This preliminary result is particularly important as it has proved that compression can both normalize readings by forearm size, and also affect non-compressed NCV readings. To elaborate, compression using a sleeve would allow for a smaller variability in forearm girth due and thus serve as a normalizer in the application of stimulation. Furthermore, a change in NCV due to compression indicates that calibration algorithms within our device will be crucial as even the level of external compression can change one’s NCV readings. Although future testing will increase our collected compression dataset, initial testing predicts a noticeable difference in NCV that motivates a need for further evaluation
Electrode Placement Testing
Ideal electrode placement positions were determined based on prior BME244L lab data alongside participant testing. With human physiology being different from person to person, our customer needs indicate that variability in forearm size and geometry needs to be accounted for. Our team has chosen to do this by evaluating data output readability by moving electrodes around the initial positions as specified in Figure 15.
To determine the electrode placement range, I incrementally shifted the electrodes away from the center point of the 'X' marks on the sleeve template in increments of 8.25 mm; this increment was utilized since the radius of electrode gel caps are 16.5 mm. Following each lateral shift, a stimulus was created and its appropriate response was recorded. After carrying out this procedure a few times for both the proximal and distal electrode pairs, I found that a minimum stimulus of 10 mA still created a noticeable response in the electrode's center within 16.5 mm of the initial ‘X’ mark. Any region outside of this created a dampened response at 10 mA, and would necessitate an increase in stimulus amplitude to achieve the same results. In sum, an iterative incremental lateral stimulation methodology was utilized to find the appropriate stimulus electrode placement range. Please note that 10 mA was chosen as the evaluating stimulus as our prior data indicated that a minimum muscle response was observable near this value.
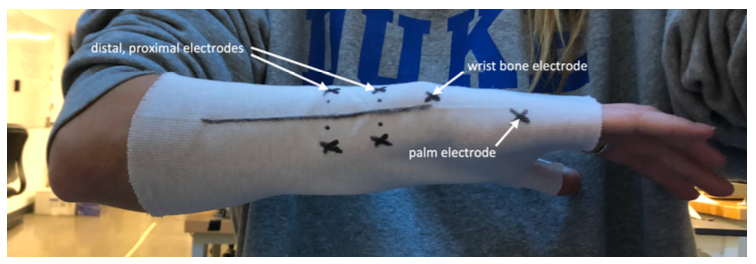
Figure 15. Ideal electrode placement positions.
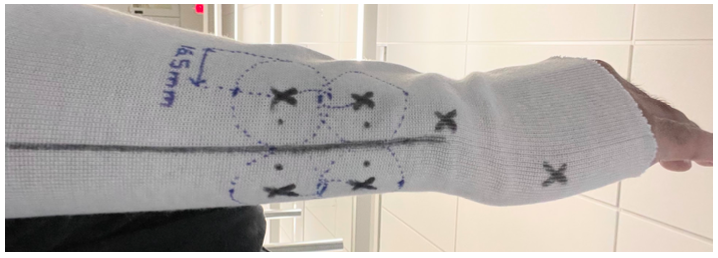
Figure 16. Electrode placement range including dashed areas which stimulation electrodes allow for interpretable data collection.
Testing determined that a radius of 16.5mm around the ‘X’ mark positions would still allow for readable data. This is crucial as it impacts device ease of use; it would be unreasonable for customers to strictly follow an electrode placement template provided both the overall age of our population, as well as variations in forearm geometries. Thus, defining a wide range in electrode placement which results in readable and interpretable data allows for an improved user interface. This will impact our design since future high-fidelity sleeve iterations will account for this known variability in electrode placement locations.
Alert System
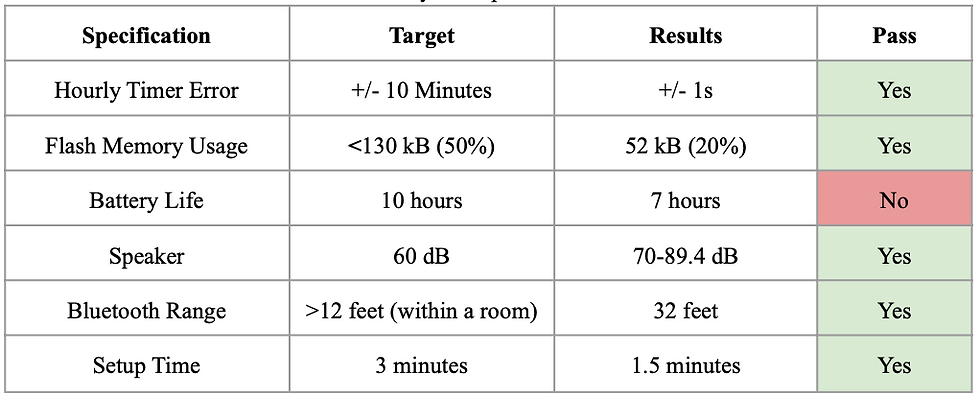
A summary of the results of testing the alert system can be found in Table 7, below.
Table 7. Results from alert system specifications that were tested.
Hourly Timer
In the Arduino’s datasheet, the time precision of Timer 1 in the Arduino is +/- 4 microseconds. Testing was performed by starting a phone stopwatch and comparing the data output times. The timing was precise to the second based on visual inspection, which is satisfactory.
Flash Memory
Flash memory usage was calculated after uploading all of the code into the Arduino MEGAs. The percentage of memory used was 20%, which was below our target value of 50%.
Battery Longevity
Battery life was estimated by testing the current draw of the main components of the circuit: the Bluetooth modules, the Arduino, and the LCD screen. These added up to a total of 100 mA. If we use a standalone 9V battery, it would have around 100 mAh of Battery capacity. This would provide us with a battery life of around 7 hours, which is just enough for a typical night’s worth of sleep, but not ideal.
Speaker
For the speaker, volume was measured using a phone app at various noise frequencies, from 500-1000 Hz. The volume ranged from 70 to 89.4 dB, which was above our target of 60 dB.
Bluetooth Range
Multiple tests were performed operating the system with the central and peripheral modules at different distances. The Bluetooth connection stayed stable at 32 feet maximum, which is much longer than the length of a typical bedroom.
Set-up Time
Setup time was tested by going through the entire software program using the longest possible user flow pathway by creating a new profile. After 5 trials, the average setup time was 1.5 minutes, which is under our target of 3 minutes.
Design Iterations
Brainstormed Solutions
To begin our design process, our team came together and each brainstormed ideas under four different categories: device enclosure (yellow), mechanism of detecting stroke symptoms (green), data collection/alert system (blue), and user interface (pink). The consolidation of our team’s favorite ideas from all of our individual brainstorming can be found in Figure 17, below.
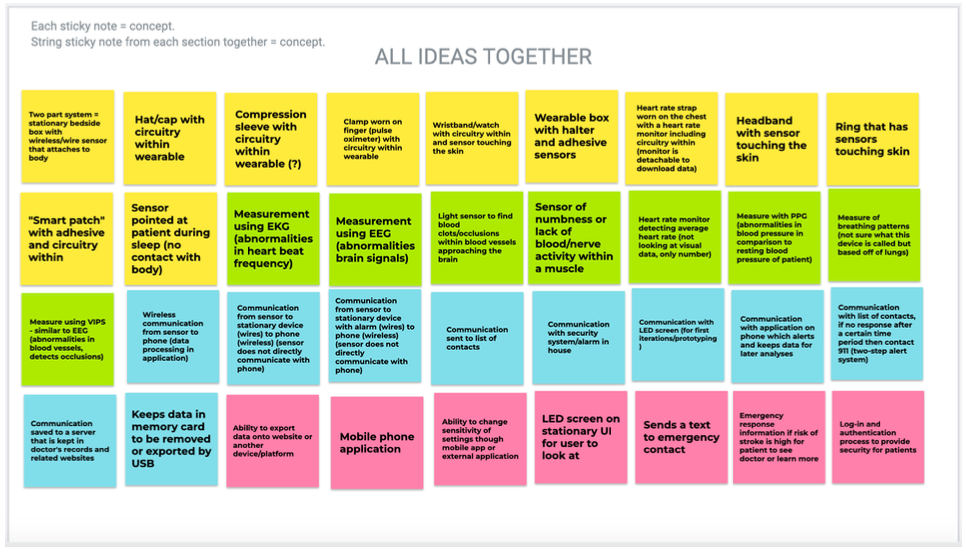
Figure 17. Consolidated initial brainstorming using Jamboard.
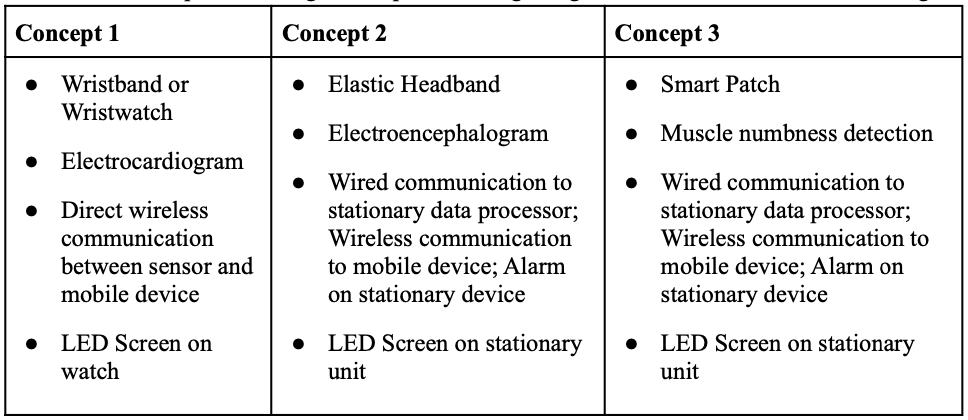
Late last semester, three design concepts were created after iterative brainstorming and in-depth design context review (Table 8). Among these, a design was chosen based on our predefined customer needs and design constraints. Through this process, concept 3 was chosen and slightly modified; rather than using a smart patch, we used an NCV-based adhesive mounting system. What’s crucial is that rather than pursuing a system with neural activity or accelerometers, we chose NCV-based electrical stimulation and a stationary alert system
Table 8. Initial product design concepts following design context review and brainstorming
Alert System Iterations
The microcontroller choice for the alarm system went through several iterations. In the first iteration, we chose to use a Bluno Beetle BLE microcontroller by DFRobot. This microcontroller was very small and lightweight, which we thought would be perfect to integrate into a sleeve design. Its Bluetooth capabilities were satisfactory, but it had limitations on the power draw and the flash memory. After discussing with Alex and Dr. Palmeri, we decided to switch to an industry standard chip (Nordic nRF52833 Dev Kit) that would produce a lower power draw and provide a more promising design for a product that will be turned on for long periods of time. Although we were able to establish Bluetooth connections and send data between two Nordic devices, we were unable to successfully program code into the Nordic as well as in Arduino. We made a last-minute switch to the Arduino MEGA with Bluetooth HC-05 modules, which we were able to successfully program into a functional device, although we ended up with a mid-fidelity prototype instead of a high-fidelity prototype.
Regulatory Standards
Public Health, Safety, & Welfare
In the United States, a stroke happens every 40 seconds, and 23% to 29% of people—about 1 in 4—can expect to have a stroke at some point in their lives (American Heart Association, 2018). Stroke is one of the leading causes of disability because more than 80% of people who have a stroke survive (UCI Health, 2019). However, survivors of stroke often live with a variety of challenges, ranging from physical to emotional to cognitive. They are also at a higher risk of experiencing a stroke in the future, and may face financial barriers to preventative care. In 2019, the American Heart Association estimated that Americans spend an annual average of $45.5 billion on direct and indirect costs of stroke. Of the $45 million, $8.2 billion was spent on home health care for stroke. In addition, stroke costs Americans $17.5 billion each year in lost wages.
Our design solution, if fully implemented, may improve public health by providing a relatively low-cost solution to nighttime stroke monitoring and reducing the risk of fatal harm from a recurring stroke in elderly populations. If symptoms of stroke are detected while someone is asleep as opposed to allowing them to develop and worsen until the morning, the costs of treatment would be reduced and patient outcomes will be improved.
Public health could be adversely affected by our design if it had a high likelihood of sounding false alarms. For example, if patients were to receive 20 false alarms for every true stroke symptom over the course of a year, this could create a large burden on the local medical system. Ambulances may have been dispatched when it was completely unnecessary, and the patient’s physician may be interrupted from their other tasks to verify if the patient was experiencing a stroke.
If our device were to be distributed in the United States and worldwide, it would have to comply with IEC 60601 standards for electronic medical devices, and IEC 62304 for the medical software that runs on the device. This will ensure that our device’s design is consistent and replicable to fit industry standards. It should also be tested by UL standards before being used publicly, to ensure public safety and increase customer confidence in the product.
When fully implemented and ready for FDA approval, our device would most likely be classified as a Class II device because there should be a relatively low risk to using our device. Our device design is meant to be minimally invasive, and only small amounts of electrical shock should be given to the patient. The maximum level of electrical shock required for our device to function (around 17 mA) is far below the threshold for a dangerous dosage of electricity (100-200 mA). If the patient experiences discomfort due to the shock while they are asleep, the current should be adjustable and calibrated to each patient’s needs. Although our device would most likely be in a Class II category, it would not be essentially equivalent to another product that the FDA has already approved. Therefore, it should require Pre-Market Authorization, or we may also be able to go through the de novo process.
There are a few additional ethical concerns surrounding our device design. In order for the device to function as expected, the device will need to store some patient information that may be sensitive, such as their phone number, the contact information of their loved ones, and the contact information of their primary physician. Additionally, if a future rendition of the device were to analyze the patient’s data history to provide the insights into their health, the device may need to store a large amount of data that it had gathered from the patient. All of these issues could potentially lead to privacy and data retention concerns, which we will need to communicate to the patient in order to request their consent.
Hazard Analysis
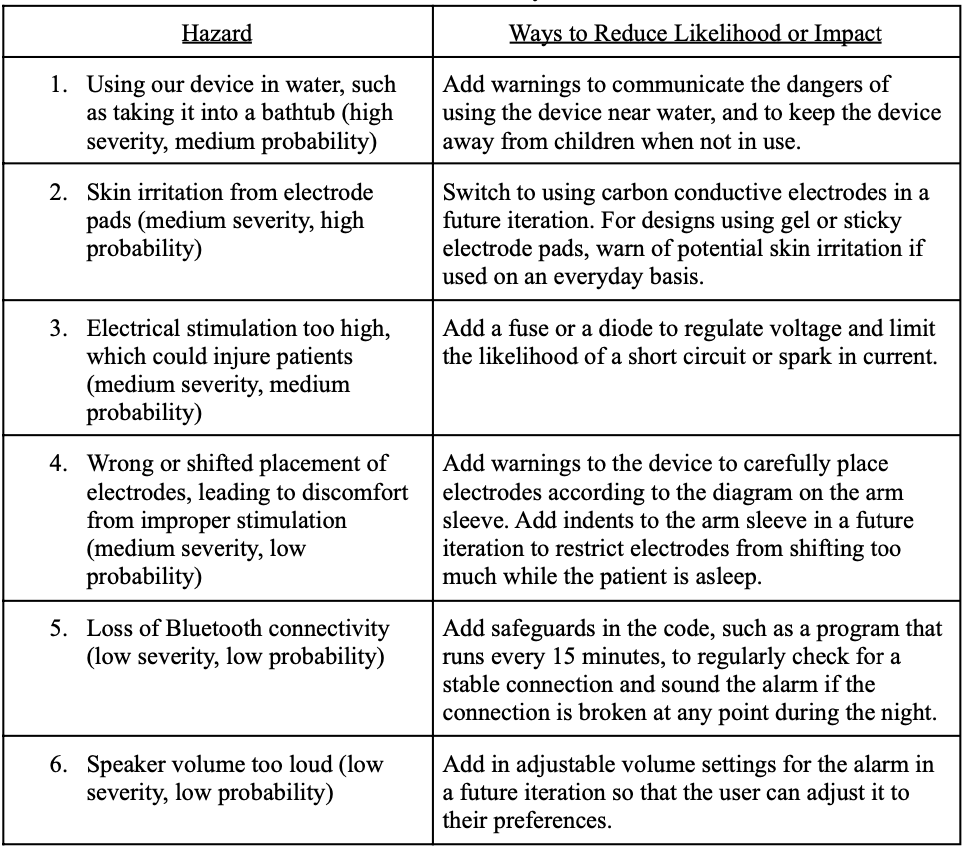
We performed a hazard analysis on the expected risk with proper functional use of the device. Our top expected hazards and ways that we could reduce their likelihood or impact can be found in Table 9, below, in order of most to least severe.
Table 9. Hazard analysis chart.
Failure Mode and Effect Analysis (FMEA)
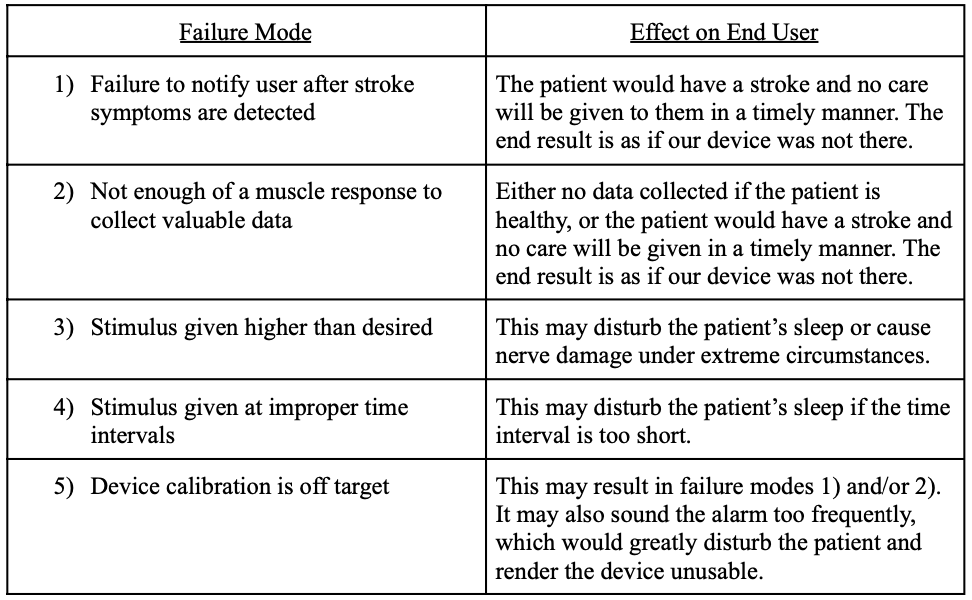
Our top failure modes and the effect on the end user during each mode can be found in Table 10, below.
Table 10. FMEA chart.
Fault Tree Analysis
Our fault tree analysis can be found here.
Additional Ethical Concerns
Global Factors
With one in four people over the age of 25 at risk of having a stroke during their lifetime, researchers have found a nearly five-fold difference in stroke risk worldwide with the highest risk geographic region being in East Asia and Central and Eastern Europe and the lowest risk being in sub-Saharan Africa (Fogarty International Center 2016). Based on Figure 1, below, the lifetime risk of stroke for 25-year-olds in 2016 ranged from 8 to 39 percent, depending on geographical location. A few countries to note have been listed below:
East Asia (38.8%)
Central Europe (31.7%)
Eastern Europe (31.6%)
High-income North America (23.8%)
Sub-Saharan Africa (11.8%)

Figure 18. Lifetime risk of stroke occurrence worldwide (Fogarty International Center, 2016).
When analyzing the global impact that our stroke detection monitor could have, these numbers become extremely significant. With the progression of processed foods, lack of regular exercise, and consistent use of tobacco and alcohol in varying regions of the world, stroke risk can often be a direct effect of these life decisions. One example of this can be seen in the heavy use of tobacco in regions of Asia and Central Europe in comparison to sub-Saharan Africa’s little to none. In addition, the caloric supply from North America to Africa can give a rough visual of the amount of processed food consumed worldwide. In 2019, the food available for consumption at the retail level in North America was around 3,500 kcal in comparison to Africa’s 2,550 kcal (Roser et al., 2013). Although this does not give direct data on the consumption of processed foods, it can be assumed that higher calorie foods, being processed foods, are transported to regions like North America and Europe in a higher capacity. All this to say, the intake of more processed foods, tobacco, and alcohol can all lead to increased risk of lifetime stroke and varies both socially and culturally by region.
Although lifetime stroke risk does vary worldwide, it is not necessarily limited to a specific country or region. Since processed foods, tobacco, and alcohol are technically accessible to all people, the potential for risk levels to fluctuate is possible with the increased popularity or accessibility in these regions of the world.
Since our nighttime stroke detection monitor is designed to be lightweight, portable, and easy to use, it would have the ability to be distributed both domestically and globally. With this being said, it is important to note any cultural nuances around the use of electrical stimulation as it is not a technology readily accessible in all regions of the world. The use of electrical stimulation may be more intimidating for patients who have not heard of or experienced its benefits in the past and therefore may be a more difficult market to engage in. Each region would need to be assessed separately through both cultural and global perceptions of the product’s key components in order to evaluate if it would be a feasible market to enter into.
Social & Psychological Factors
Society and culture are related concepts, but are not the same. Society is defined as a group of people who live together and share a set of values and beliefs. In contrast, culture is defined as that set of values and beliefs that defines a group of people. Hence, these two concepts differ in that:
Society is a group of people, whereas culture is the set of values, beliefs, and behaviors shared by those people
Society is a social organization, whereas culture is a set of guiding behaviors
Society is a physical entity, while culture is a set of ideas and customs.
Provided this definition of society and culture, in the context of our medical device, it’s clear that our device does not address a problem faced by individuals globally. Our device is targeted towards assisting secondary stroke-risk patients above the age of 55 - a subset of society. Within our global society, individuals do not face a risk of secondary stroke uniformly; even individuals within our targeted population don’t face risk of secondary stroke uniformly.
Our problem and solution (increased secondary-stroke risk within the population age 55 and older) vary as a factor of age. Age is a mediating factor due to the obvious restriction of our target population to those 55 older. Furthermore, our solution is only suited for use among the adult population and cannot be applied to younger children and infants. Gender is a mediating factor only within our problem since recent research (Rexrode et. al, 2022) indicates that women face a disproportionate burden of stroke mortality and disability. Please note that although gender and sex are different, non-binary concepts, researchers indicate that “findings for sex differences may represent the combined impact of both sex and gender, and gendered exposures may contribute to observed differences between men and women” (Rexrode et. al, 2022). Thus we can safely indicate gender as a variable for our defined problem.
Provided these variables, one may consider what modifications can be made to the current product design to account for this broader population. In regards to age, our product can be scaled down to account for varying arm lengths and sizes among children and infants. Furthermore, an alternative method to adhesive can be devised to allow for size scalability; one option might be using smaller electrodes and a compression sleeve rather than large, immobile adhesive electrodes. In regards to gender, no improvement is necessary since our device is blind towards the severity of stroke risk. Additionally, risk of stroke is evaluated by calibrating to user-specific metrics, thus accepted NCV variability is unique to the person’s physiology and not biased towards a specific gender.
The only societal factors that may impact product adoption are media consumption and general social media use. Given our product needs to be marketed to allow for widespread adoption, the societal rate of consumption of information will impact how many individuals our product will reach. Furthermore, norms surrounding medical marketing and the adoption of products by doctors will also impact product usage.
Cultural Factors
The cultural pervasiveness of stroke, although often not seen by those unaffected, is a key component in the social and psychological state experienced by survivors around the world. Due to our product’s ability to be marketed throughout the world and to all people, it is important to understand the variation in perceptions from potential users in regards to race, ethnicity, gender identity, diet, and general lifestyle factors.
As research has shown, African American, Hispanic American, and Indian American/Alaska Natives are more likely to experience stroke in their lifetimes than that of the white population (NICHD 2022). In addition to this, there are significant health disparities for Black Americans in comparison to that of White Americans; this means that there is a particular health difference closely linked with social, economic, and/or environmental disadvantage (Love et. al, 2022). Black stroke survivors in the US are also more likely to receive lower quality care than their white counterparts (Love et. al, 2022). These disparities can be heavily linked to the presence of racism operating in the structural, cultural, and interpersonal levels of the US healthcare system as well as institutional systems throughout the world. In regards to gender and sexual orientation, similar disparities can be linked to homophobic behaviors and stigmatization operating in the institutional US and around the world. Lastly, diet and positive lifestyle changes such as regular exercise and avoidance of tobacco/alcohol are directly linked to a decrease in lifetime stroke risk (CDC, 2022). The monitoring of cholesterol, blood pressure, and any diseases such as diabetes or heart disease are major steps that can be taken to reduce a person’s risk as well. Many of these lifestyle changes have a healthy stigma in most parts of the world and, therefore, would only be to a person’s advantage to implement in their daily routine.
Among the cultural factors listed above, our team does not foresee the adoption of our solution to be predicated heavily off of any of these racial, gender, or health disparities. The main influence we see in the adoption of our solution would be a lack of knowledge on electrical stimulation in regards to its benefits, risks, and overall stigmatization. Our team recognizes this component of our design as a potential obstacle, but we believe that proper communication of the feature can mitigate these effects greatly.
Environmental & Economic Factors
Given the current status of our device, some of these considerations will be made on assumptions for the materials and equipment that a future, more refined prototype of our design may use.
When manufacturing our device, we would need to contact manufacturers for the microcontroller chips used in our design (most likely the Nordic nRF52833 or the ATmega2560), enclosure, PCB boards, batteries, and electrical stimulation equipment (such as electrodes). The overall cost of our device should be no more than $100, not considering any equipment we may need to use to replace the iWorx system (which is very expensive, according to Liz). This also does not take into account the costs of replacing electrode pads (~50 cents each), which would add up over time. Any metal components of our design (such as our microcontroller and our PCB board) and the production of our batteries will have the largest effect on the environment. Extraction methods for gathering metals and chemicals that may be needed for battery production (such as lithium) could consume appreciable amounts of energy. On the same vein, there may be hazards associated with the disposal of these components, particularly the batteries.
To reduce environmental footprints, we should make careful decisions on the reusability and recyclability of our components. All aspects of our design should be reusable except for the electrodes, which will be disposable. The battery should be rechargeable and therefore be expected to last a considerable amount of time without replacement. However, in a situation where the device is no longer needed, there should be appropriate instructions to the consumer on how to dispose of the device or return it to us for end-of-life processing. At the end-of-life of our device, the enclosure should be the component that is most easily recycled, if we were to manufacture it with recyclable plastic or wood. Any microcontroller chips or PCB boards that are still in good condition should be refurbished into new products, which could be sold at a discounted price.
In addition to manufacturing, our device would require a considerable amount of packaging and shipping, because it would be sent straight to a patient’s home. We would require padded packaging to ensure that our device arrives in good condition, as well as instruction manuals for how to set up and initialize the device. Here, we can switch to using online instruction manuals and videos to reduce environmental impact, and we can also consider using recycled paper and biodegradable materials in the packaging. We could also coordinate with the distributor to send out many orders at once to reduce shipping costs, although this may lead to a longer wait time for the patient to receive the product.
Since our device will be an at-home bedside monitoring device, it will most likely be paid by the family of the patient. At the moment, this type of device is not under the list of durable medical equipment that Medicare/Medicaid cover. Additionally, this device may not be considered essential to the patient’s life, depending on the likelihood that they may have a recurring stroke. Therefore, this device may not play a large role in Medicare/Medicaid cost concerns, but it does pose a financial barrier to families that may want this device for their loved ones. Our solution would most likely have the most direct impact on a local or state-level scale. However, if it were to be very effective and implemented across the country or the world, it would have much larger implications on overall public health, such as limiting the harm of recurring strokes and reducing the costs of stroke treatment worldwide.
Project Notes
Methods of Organization/Communication:
GoogleDrive (shared documents)
Microsoft Teams (communication)
Trello (Kanban organization board)
Software/Tools:
LucidCharts (functional decomposition, user action flowchart)
Skills:
Programming Languages