(713) 501-3336
Pediatric Crash Dummy Neck
Fall 2022
The goal of our project was to design and evaluate a neck for the six-year old crash test dummy alongside creating and analyzing performance (bio-fidelity) specifications for the overall design. The project proposal stemmed from group work in BME432L, a design course dealing with contemporary issues in the biomechanics of injury and motor vehicle safety engineering, and was carried through to the extent of the semester.
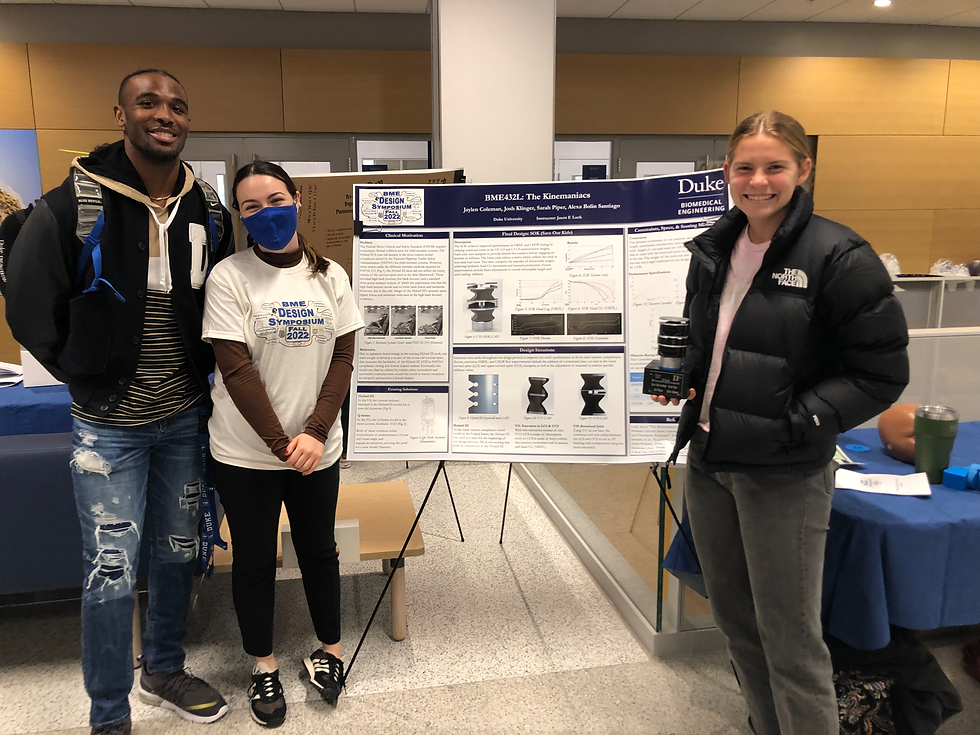
Special thanks to my BME432 team members for their willingness and patience to learn, iterate, and design alongside one another! Our group included team members Jaylen Coleman, Josh Klinger, Alexa Santiago, and myself!
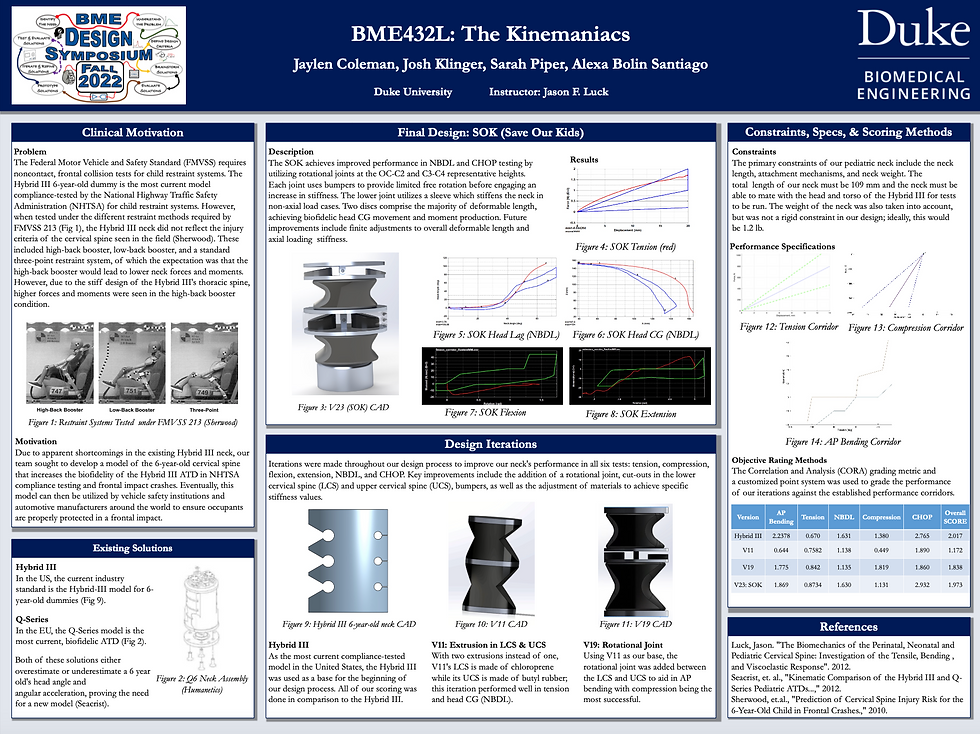
Children are significantly more susceptible to severe injury than adults in frontal impact car crashes, potentially because the loading behavior in current ATD models does not match that for the average 6-year-old child. As a result of this, inaccurate injury criteria are being used to justify safety features in cars today. In order to account for these oversights, our team has iterated through a variety of prototypes based on previous literature while simultaneously engaging with and scoring these iterations through means of finite element analysis (FEA) and objective rating methods. Currently, the Hybrid III 6-year-old ATD is the industry standard for automotive manufacturers and child restraint devices in validating designs for occupant protection within FMVSS regulations. Our team’s goal is to develop an improved model of the pediatric cervical spine for the 6-year-old Hybrid III ATD that increases biofidelity and enables enhanced prediction capabilities of both neck and head injuries during a frontal car crash. As a result of our team’s iterative design analysis, we’ve created the SOK (Save Our Kids); this prototype is compatible with the Hybrid III pediatric cervical spine and is thus capable of being tested in the same testing apparatuses as the Hybrid III. This design includes two rotational joints and three-disc sections representative of the intervertebral neck. Our model has been defined and scored within course corridors for tension, compression, CHOP, NBDL, and A-P bending test cases. Ultimately, our final model scored just below the Hybrid III, however it improves on several key shortcomings of the existing model with respect to head motion and moment induction during a frontal impact; this scoring does not take into account the weighting of different load cases, an improvement we would focus on in future iterations of our model.
Problem
With vehicular safety being of utmost importance in our society today, the design of an accurate and biofidelic crash test dummy neck is imperative to reduce the number of fatal head and neck injuries occurring today. The IIHS reports that car crashes account for 25% of all unintentional injury deaths in children, which indicates the prevalence of a need for biofidelic pediatric ATDs. With most US companies using the current Hybrid III ATD, the release of safety products such as seatbelts, booster seats, and tires that were expected to decrease fatalities in car crashes have not had as significant of an effect as the company had hoped; this is because, although the Hybrid III has been named the industry standard, it still has flaws in its representation of a frontal impact car crash. Since these safety features have not yet been tested with a neck representative of loading behavior in the 6-year-old (6YO) child, these products will continue to allow for fatal head and neck injuries until a more accurate model is able to replace it.
Market
Companies in the automobile industry as well as those who market various safety features such as car seats, seat belts, tires, and airbags are the businesses in need of our product as its utilization would ideally aid in a more effective automobile design. This would include automobile companies like Ford and General Motors as well as Britax, Continental, Michelin, and Autoliv. Another population that may use our product would be crash safety research facilities and engineer consulting firms. Many of these research facilities are associated with academic institutions such as Penn State and Texas A&M, thus, we would be marketing to these universities.
Public Health and Safety
Traumatic injuries are found to be the leading cause of death in children aged 1-19 years old in the United States and are chiefly caused by motor vehicle collisions (Dibb et al. 2014). In addition, more than 260,000 children die annually as a result of these collisions with up to 10 million children suffering non-fatal injuries (Peden et al. 2012). In many of these collisions, the head is the most likely region to be injured with the neck, though not commonly injured, having significant influence on head injury as well. Anthropomorphic testing devices (ATDs) such as the Hybrid III are used to evaluate the impact of these collisions on the head and neck regions.
Social and Economic Factors
As a general rule, the Association for the Advancement of Automobile Medicine (AAAM) recommends booster seats to be used for children between the ages of 4 and 10 years old who weigh more than 18 kg. (40 lb.) and has a sitting height of 145 cm. (57 in.). Recent studies have shown the greater effectiveness of high-back and low-back booster seats for children of this size in comparison to those using a three-point seat belt (Durbin et al. 2003). However, in a study conducted by the Center for Applied Biomechanics at the University of Virginia, the Hybrid III dummy neck exhibited higher forces and moments during a frontal sled test when restrained in a high back booster than with a three-point seat belt (Figure 6). Since these results did not agree with injuries seen in the field, it was concluded by the study that the high stiffness of the Hybrid III’s thoracic spine was the cause of these increased forces. Because of the proven lack of biofidelity in the Hybrid III cervical spine performance, there is an unmet need in the current 6-year-old neck design and pediatric, vehicular safety.
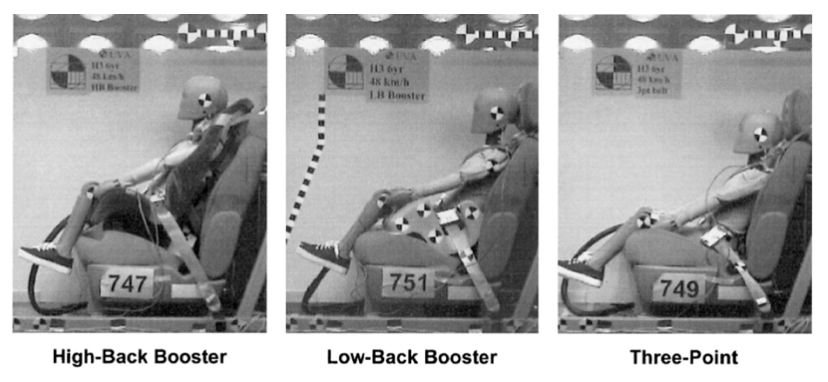
Figure 1. Dummy restraint conditions in a minivan bench seat (Sherwood 2003).
Current Available Models
Manufactured by Humanetics, the 6-year-old Hybrid III crash dummy neck in the Hybrid III Children Series is the current industry standard for crash safety tests in the United States. In addition to the 6-year-old model, the Hybrid III series includes a 3-year-old, 10-year-old, and weighted 6-year-old model as well. Originally developed in 1993 in cooperation with the National Highway Transport Safety Administration (NHTSA), the anthropometry of the dummy was derived by NHTSA research studies and its associated corridors were derived by scaling of the adult dummies. The model for the neck is segmented, flexible, and composed of molded butyl rubber.
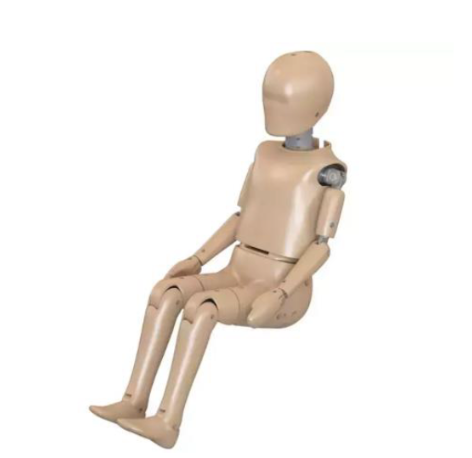
Figure 2. Hybrid III 6YO ATD.
A second available model in the US, the Test device for Human Occupant Restraint 50th percentile male (THOR-50M) is also manufactured by Humanetics, but is only available in one size. Available in adult male and female models, Humanetics markets the THOR as their most sophisticated ATD model for assessing whole-body trauma in a variety of occupant restraint environments. The THOR-50M is developed for frontal impact car crashes, this model has been in continuous refinement since 1995 and is currently being validated by the NHTSA and Euro NCAP. Although this model is available to be used in crash tests today, the Hybrid III is the current industry standard due to its variety of test dummy ages and greater amount of testing done as of now. In addition, the THOR model showed a variety of durability issues when tested (Seacrist 2006).
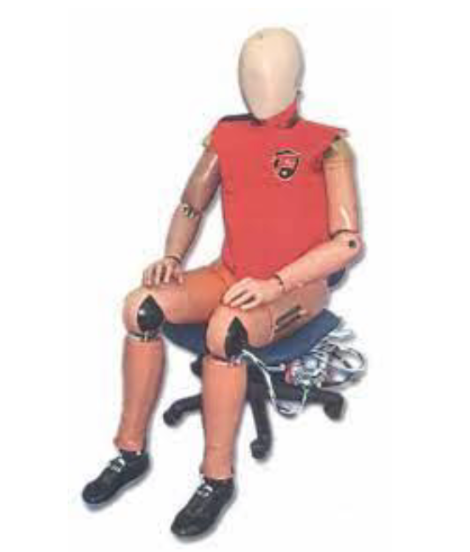
Figure 3a. THOR 50th percentile male ATD.
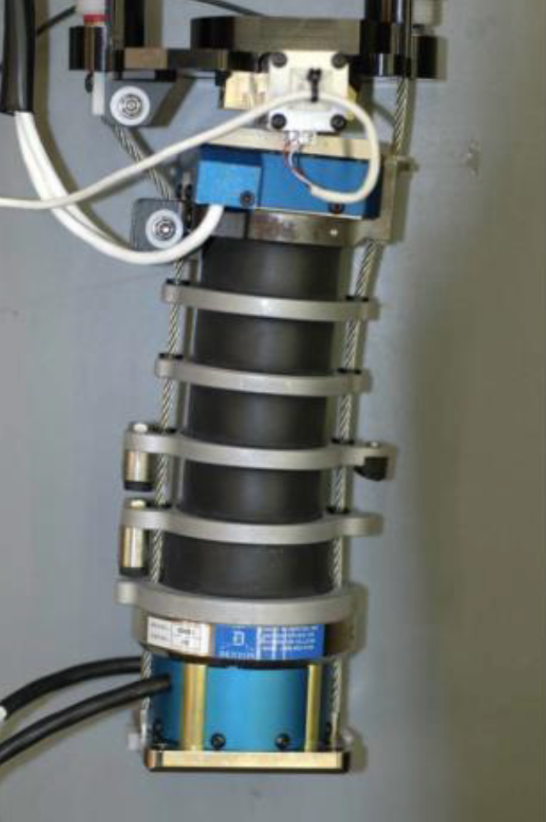
Figure 3b. THOR 50th percentile male ATD neck.
In the European Union, the P-series and Q-series have been the main ATD models used on the market with the Q-series overtaking the P-series in 1993. The P-series is comprised of six different test dummies. These dummies have an emphasis on child occupants and include the P0 (newborn), P3/4 (9 months), P1 ½ (18 months), P3 (3 years), P6 (6 years), and P10 (10 years). The dimensions and mass distribution of the dummies represent the 50th percentile child for each age. Also manufactured by Humanetics, the 6-year-old P6 crash dummies were the first European child dummies to become official in 1981. Despite being simple in design, the P-series has contributed a substantial amount of information to the safety of child restraint systems in cars. However, the P-series has become less suitable for the testing of airbags and seatbelt systems over time. The Hybrid III series was one of the models developed to address this child-airbag problem in the United States while the Q-series has worked to do the same in Europe.
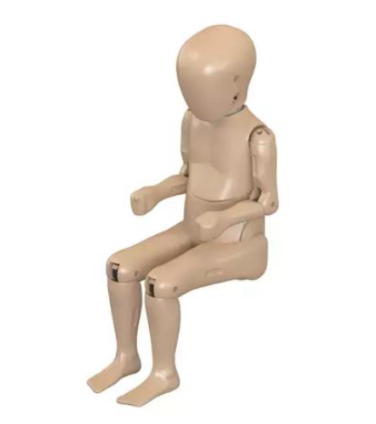
Figure 4. P-series 6YO ATD (P6).
Another product of the EU, the Q-series was developed in 1993 by the international Child Dummy Working Group (CDWG) in hopes of replacing the P-series dummies and giving engineers more accurate information to design greater impact protection for children in cars. The Q-series family has the largest range of all including the Q0 (6 weeks), Q1 (12 months), Q1.5 (18 months), Q3 (3 years), Q6 (6 years), and Q10 (10 years). Strengths of the Q-series models in comparison to the P-series include better anthropometry, biomechanics, and kinematics. Similar to the P-series, the Q-series can be used in frontal and side impact testing. The neck consists of rubber segments between metal plates to allow for comparable flexion, extension, and lateral flexion behavior to the 50th percentile child.
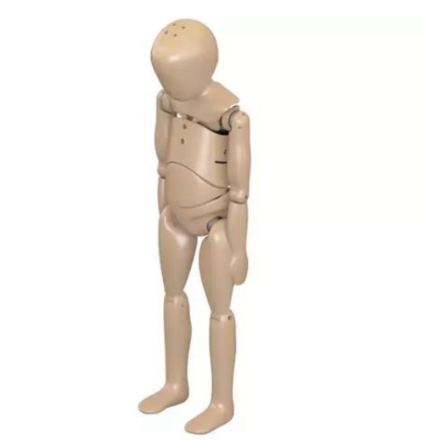
Figure 5. Q-series 6YO ATD (Q6).
Lastly, the EU-funded PIPER project was established to develop user-friendly tools to position and personalize advanced Human Body Models (HBM) for use in designing safer vehicles; this is due to many of the current models’ lack of variability in both age and positioning. The idea is for any researcher to apply the same positioning and scaling in a variety of different codes in order to obtain models in need of no correction. By creating an Open-Source software, the project developers have been able to work with industry users to advance the simulation and morphing techniques used to combat these shortcomings in positioning and personalization. The main goal of these simulations is to better understand the interaction between children and child restraint systems during car accidents by means of an easy-access software framework. The PIPER child model aims to be scalable between 1.5 and 6 years of age and was developed using LS-DYNA code. Just like the aforementioned 6-year-old child models, the insufficiency data on the pediatric response to impact in comparison to that of the adult make for a far less advanced simulation. For this reason, the advancement of pediatric data in the context of crash test modeling is crucial in the further progression of road safety.
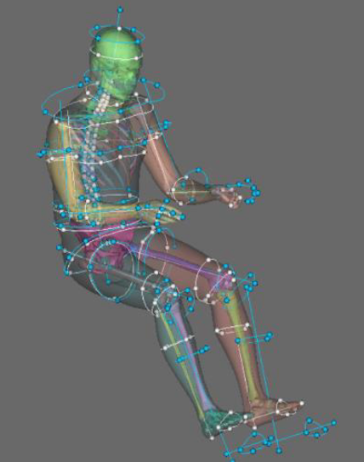
Figure 6. HBM scaling in PIPER framework.
Constraints Due to the eventual loading of our model neck into a testing apparatus as well as into the 6-year-old crash test dummy, there are a variety of constraints that our team needed to abide by in the design of our model neck. These constraints include design features such as neck length, mating of parts, and neck weight.
The length of the neck, assuming exclusion of the Hybrid III’s nodding plate, must be 109.1 mm; this is a rigid constraint and must be met in order to physically test the device and maintain compatibility with the Hybrid III head and torso. If using the nodding plate as the connection to the Hybrid III 6-year-old head, the length of the neck allotted is 99.4 mm.
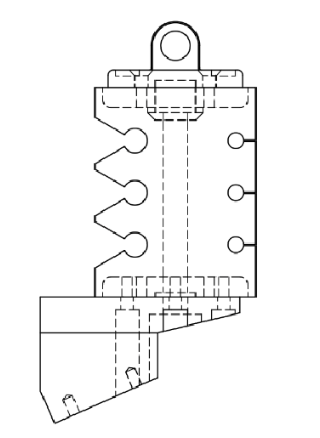
Figure 7. Full Assembly of Hybrid III 6YO neck.
On the other hand, the mating of the neck is not rigid and is open to alternative solutions. In the Hybrid III assembly, the head and neck are connected to one another by a load cell mounted on the head. There is an occipital (OC) pin on the nodding plate that makes this connection and allows for front-to-back head movement. Although the Hybrid III made use of the nodding plate to connect the Hybrid III neck to the 6-year-old pediatric head, our design is not constrained to this method of mating. The nodding plate is not a necessary component of the testing apparatus, but the load cell is.
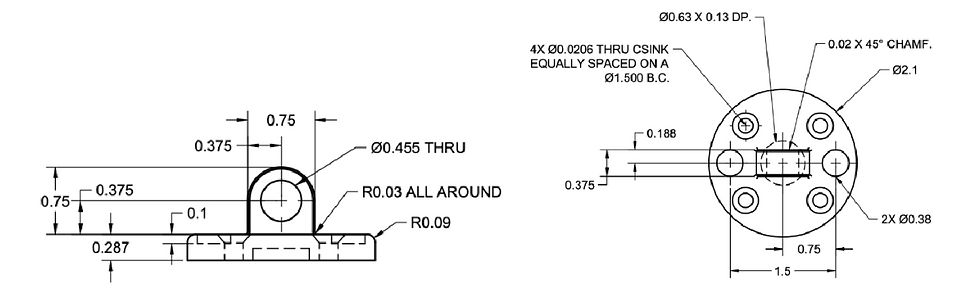
Figure 8a-b. Hybrid III 6YO nodding plate side view (a), and top view (b).
In addition, the top plate of the Hybrid III neck attaches to the base of the skull by means of a circular frame which rests inside the base of the head and the bottom plate attaches to the top of the torso by means of four screws in the neck bracket.
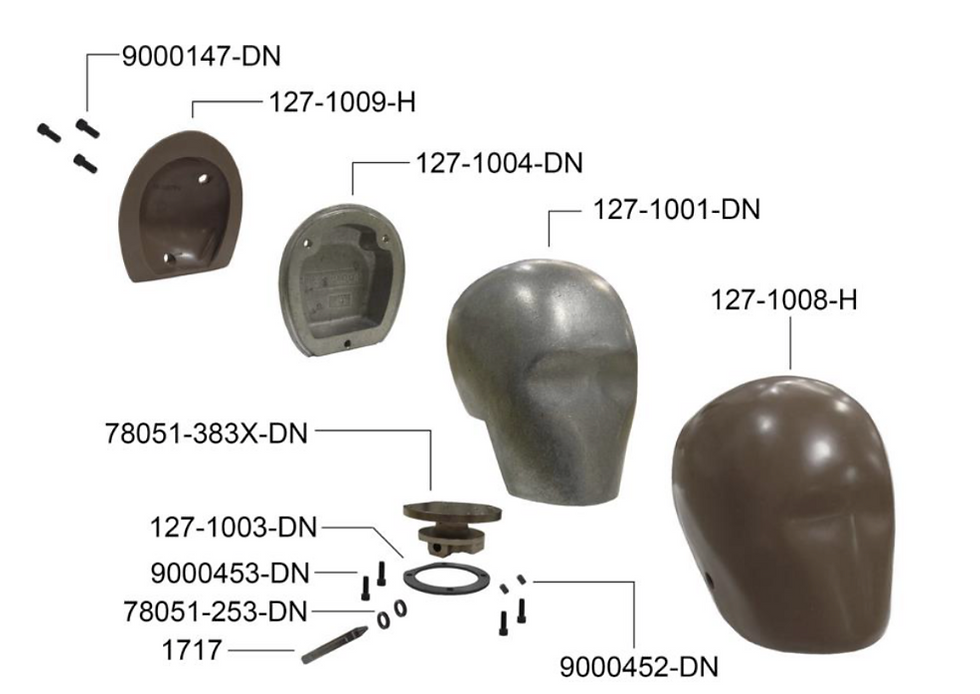
Figure 9a. Hybrid III 6YO head assembly.
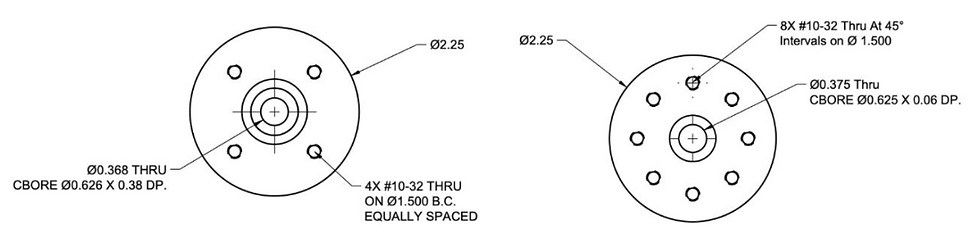
Figure 9b-c. Hybrid III 6YO top plate (b), and bottom plate (c).
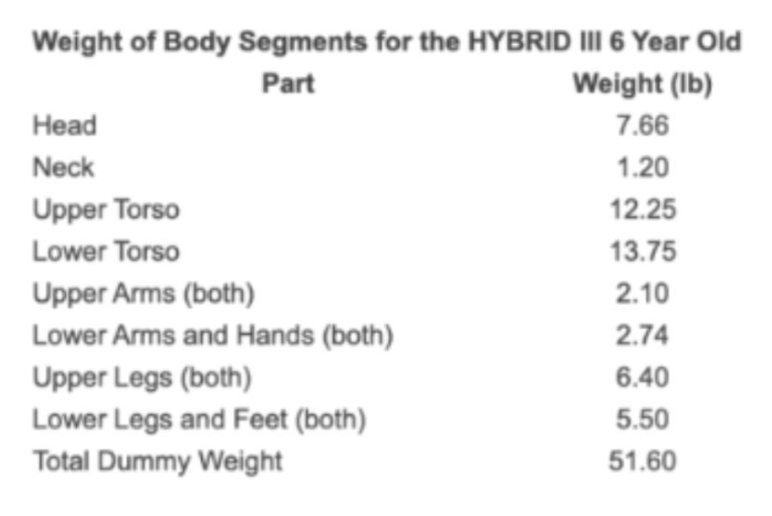
Lastly, the weight of the neck is a constraint that is not rigid, but, if possible, the ATD mass and mass distribution should maintain biofidelity in order to properly respond to the specified load cases. There are no current specifications on the Hybrid III 6-year-old neck weight, but the adult neck weight is 1.7 kg. Additionally, the weight of the pediatric WCS neck model for the Hybrid III 6-year-old was 1.2 lb. (0.54 kg.). For reference, Table 1 provides the weight distribution of the body segments for the Hybrid III 6-year-old crash test dummy.
Table 1. Hybrid III 6 YO weight by body segment (Irwin 1997).
Class Performance Specifications
For evaluation of our model’s performance, each version was scored against the agreed upon class performance specifications in order to allow for comparison between teams. These corridors were created by collecting cervical spine data from a range of ages as well as utilizing computational methods and established scaling equations. From these methods, each group was able to propose their own corridor for tension, compression, and AP bending representative of a large amount of cervical spine crash test data from a variety of literature. Class performance specifications did not include NBDL and CHOP as those corridors were provided already.
Tension Corridor
The tension corridor established by our class can be seen in Figure 10, below. From top to bottom, the corridor includes an upper bound (dashed), mean line (solid), and lower bound (dashed). This corridor is meant to be used for data between displacements of 0 and 20 mm as that is a typical range of head displacement in the pediatric neck. The model neck is found to be too stiff if it performs above the upper bound and too deformable if it performs below the lower bound.
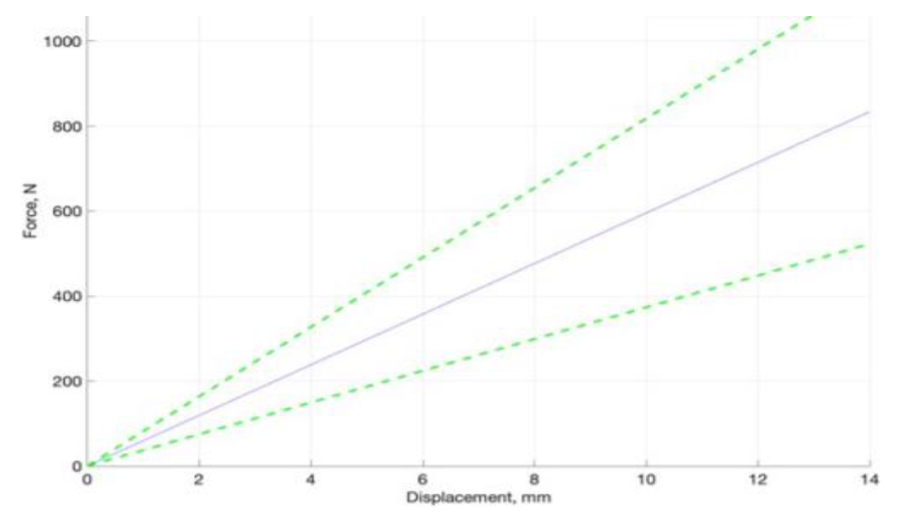
Figure 10. Class performance specification corridor for tension.
Compression Corridor
The compression corridor established by our class can be seen in Figure 11, below. From top to bottom, the corridor includes a lower bound (dashed), mean line (solid), and upper bound (dashed). This corridor is meant to be used for data between displacements of 0 and 40 mm as this corridor was developed based on loads experienced with a maximum of nearly 2000 N. The model neck is found to be too deformable if it performs above the lower bound and too stiff if it performs below the upper bound.
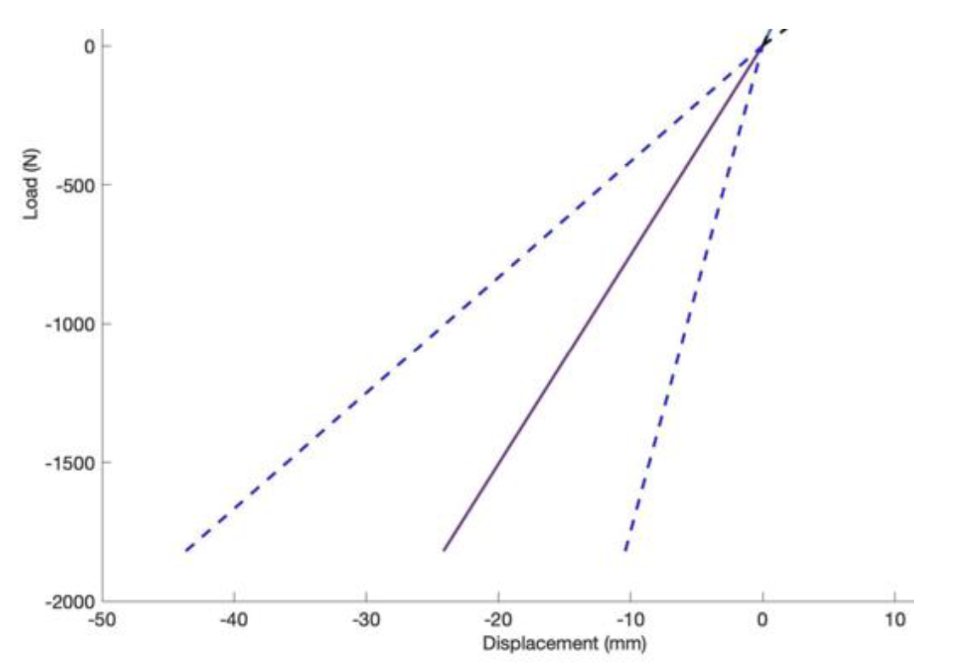
Figure 11. Class performance specification corridor for compression.
AP Bending Corridor
The AP bending corridor includes performance specifications for both flexion and extension with flexion being in the positive x-direction and extension being in the negative x-direction. The AP bending corridor established by our class can be seen in Figure 12, below. For flexion, the upper bound is on the top and the lower bound is on the bottom. For extension, the lower bound is on the top and the upper bound is on the bottom. There is no mean line for this corridor. The model neck is found to be too deformable in flexion if it is below the lower bound and too stiff if it is above the upper bound. Alternatively, the model neck is found to be too deformable in extension if it is above the lower bound and too stiff if it is below the upper bound.
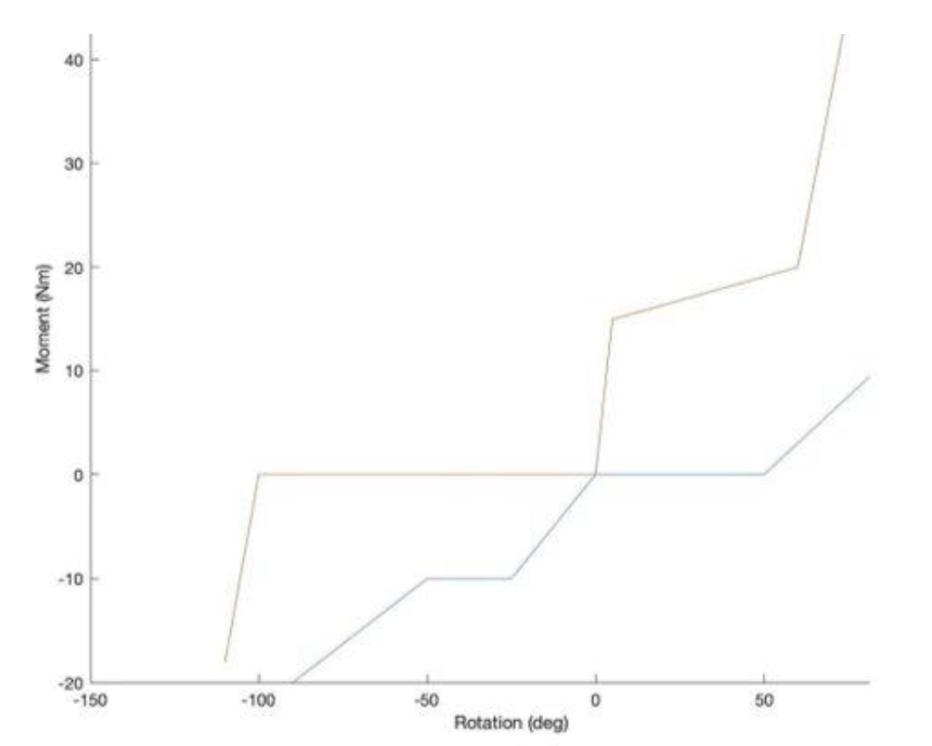
Figure 12. Class performance specification corridor for AP bending.
Team Performance Specifications
Tension Corridor
When creating our team’s biofidelic corridors for tension, the stiffness values of nine different cervical spines were evaluated from a variety of literature. Some of the pieces of literature we reviewed contained more than one cervical spine specimens and, therefore, provided more than one sample. Information on each specimen can be found in Table 2, including the respective study they originated from.
Table 2. Cervical spine data for team tension corridor.
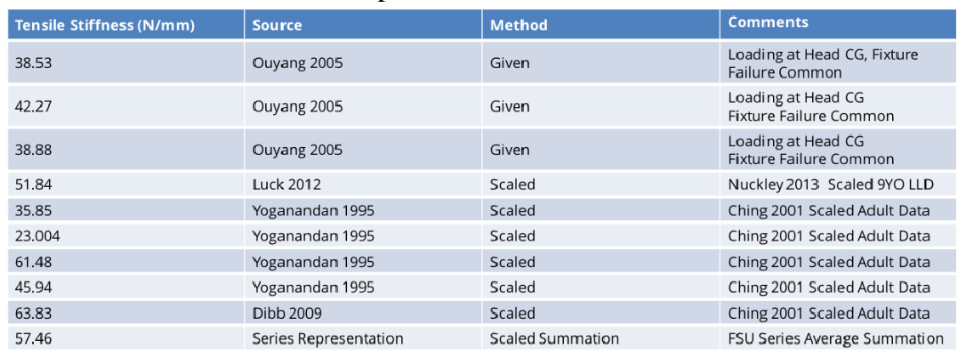
The whole cervical spines utilized in this corridor creation include both pediatric cadaveric specimen and adult specimen scaled as indicated. This is due to the limited availability of pediatric cervical spines for biomechanical testing. The final cervical spine model demonstrated provides a culmination of both human and animal specimen functional spinal units in load testing, summed as a spring system in series to comprise a whole cervical spine.
Our final tension corridor made use of 95% confidence intervals as well as the mean of the data and can be seen in Figure 13. The mean of the data was calculated by averaging the stiffness values for tension of all nine specimens found in Table 2, above, and was reported as 59.57 N/mm. The 95% confidence interval was then calculated for an N of 9 specimen. In reporting the mean, natural given pediatric data was weighed higher than scaled data, in order to give preference to the utilization of existing pediatric cervical spine data rather than scale factors. It is however worth noting that the series summation of FSUs resulted in the closest stiffness to the mean despite not being heavily weighted.
In tensile loading conditions of pediatric cervical spines, often the first point of failure prior to radiographic spinal injury is the spinal cord (Luck 2012). As such, the IARV for tension was reported to be an approximate displacement of 8.3 mm, built off of an adult IARV of nearly 9 mm (Yoganandan 1996).
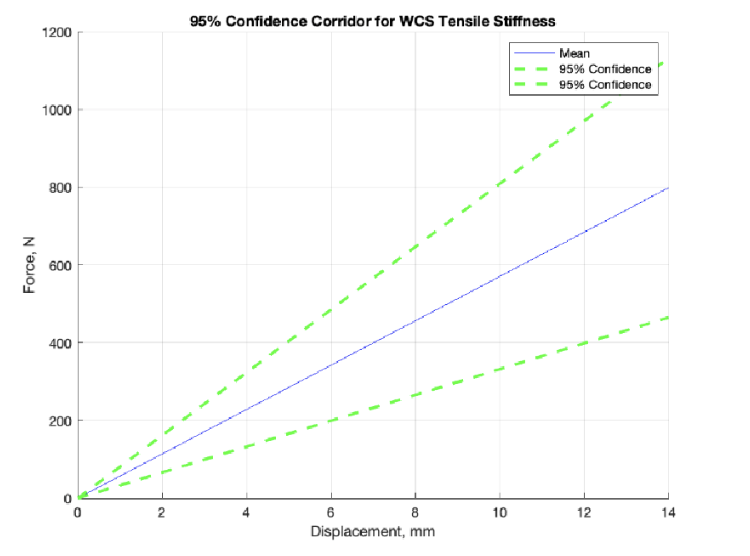
Figure 13. Team performance specification corridor for tension.
Compression Corridor
Our team’s compression corridor was created by consolidating literature values of the compressive stiffnesses of the osteoligamentous neck. With limited data available for the strength of a 6-year-old cervical spine in compression, adult models were used to determine the overall behavior of a human neck in compression. Analysis of both the upper, lower, and entire cervical spine were combined together to accurately model compressive stiffness.
Research from Przybyla et al. measured stiffness of the upper cervical spine in adults until failure. Similarly, Moroney et al. determined the displacement of the lower cervical spine in compression while increasing the force. Another study by Pal et al. examined the response of the entire adult osteoligamentous neck in compression. The results of each of the three adult compression measurements were then compiled to model the stiffness of the neck in different regions. A scaling factor was then used to convert the results of the average adult neck into a corridor that resembles the stiffness of a 6-year-old neck (Irwin 1997).
Upper and lower bounds of the corridor were created by using two standard deviations from the mean of the adult data compared to the dissected stiffness segments used in Nuckley’s study; these segments were broken into C1-C2, C3-C5, and C6-C7 for 6-year-old ATDs (Nuckley 2013). Injury in the neck due to compressive loading was identified as the ultimate failure loads of OC-C2 section due to the high occurrence of child mortality as a result of upper cervical spine fractures (Nuckley 2007). Other injury assessment reference values found the total deformation or displacement of the neck in compression as an indicator of injury (Melvin 1995).
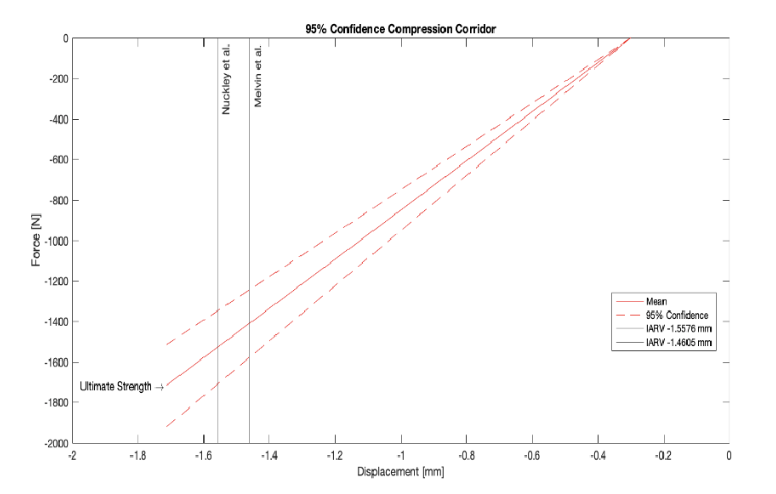
Figure 14. Team performance specification for compression.
AP Bending Corridors
The corridors created for AP bending utilized experimental data from literature in order to assess loading behavior in studies using the 6-year-old ATD (Luck 2012). Although many ages were tested in this study, the 6-year-old (72 months) data was the only set of values used. The study recorded rotation under low moment loads on 6-year-old cadavers in order to develop a regression model; this regression model was used to create our corridors (Table 3, Figure 15).
Table 3. Regression model for low moment-angle relation in upper, middle, and lower cervical spine for many ages (Luck et al. 2012).

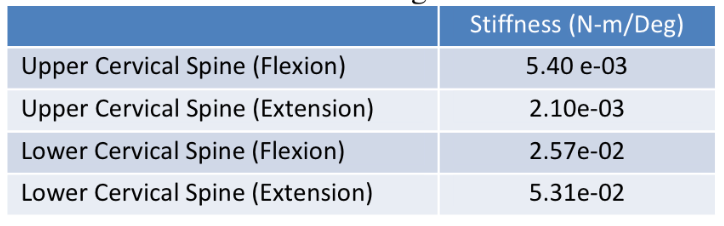
Stiffness values for the upper (O-C2) and lower (C6-C7) cervical spine segments were also calculated based on the age-based model created by the study (Table 4). One adjustment our team made involved adjusting the stiffness values to get a better estimate of the linear behavior observed from the corridor as the R2values from the model were all relatively low (Table 5). Although we did not quantitatively asses how close these new values were to the observed stiffness, the fit appeared much closer to the moment-angle corridor.
Table 4. Stiffness, age-based model (Luck et al. 2012).
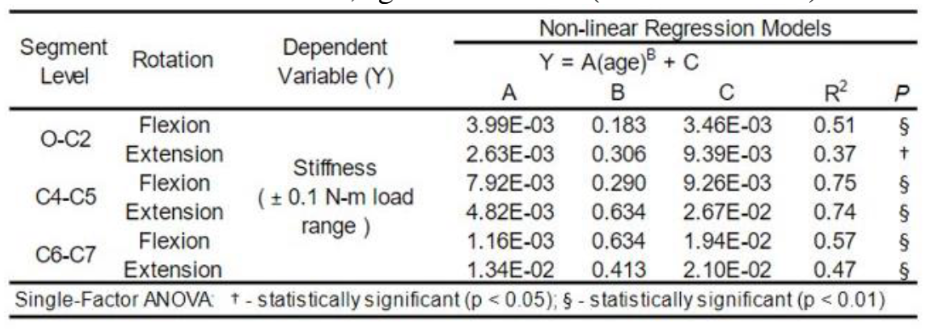
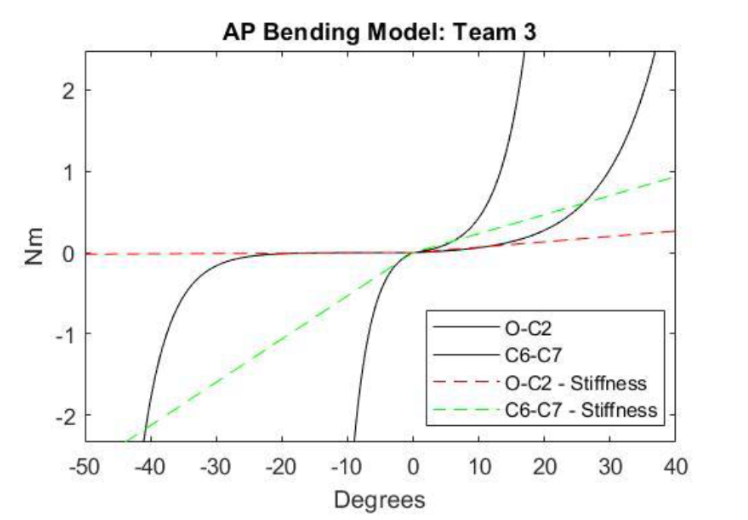
Figure 15. Team performance specification corridor for AP bending.
Table 5. Team AP bending stiffness values.
Ideally, the team would have wanted to expand the bending corridors, encompassing the greater angles of rotation and higher moments that the pediatric neck experiences, but given our transition to the overall class corridors, this remained as an item for potential future advancement. .
Injury assessment reference values (IARVs) were calculated using a scaling factor developed from an animal study in which adult IARVs were scaled to that of a 3-year-old and validated by conducting sled tests with pigs of a similar size (Irwin 1997). This scaling factor was calculated using the following relationships:
𝜆𝑐= 𝑁𝑒𝑐𝑘 𝐶𝑖𝑟𝑐𝑢𝑚𝑓𝑒𝑟𝑒𝑛𝑐𝑒 𝑜𝑓 6-𝑦𝑒𝑎𝑟-𝑜𝑙𝑑 𝑁𝑒𝑐𝑘 𝐶𝑖𝑟𝑐𝑢𝑚𝑓𝑒𝑟𝑒𝑛𝑐𝑒 𝑜𝑓 𝑎𝑑𝑢𝑙𝑡
𝑀1=𝜆3𝑐 ⋅ 𝐴𝑑𝑢𝑙𝑡 𝐼𝐴𝑅𝑉
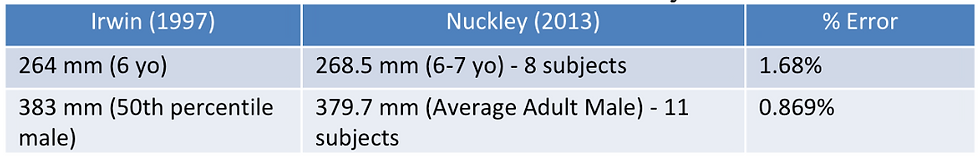
One weakness the team noted when looking at where the study found their neck circumference values was that they simply used the ATD’s neck circumference for the given age group. In order to validate these neck circumferences as truly being representative of that age group, we compared the neck circumferences to those of real subjects (Nuckley 2013). After conducting a percent error analysis between the neck circumference values of the Hybrid III dummies and those averaged across multiple participants in Nuckley’s study, the team determined the data to be reliable as the error was under 10% in both age groups studied (Table 7).
Table 7. Error calculation between Irwin and Nuckley neck circumferences.
Final Design
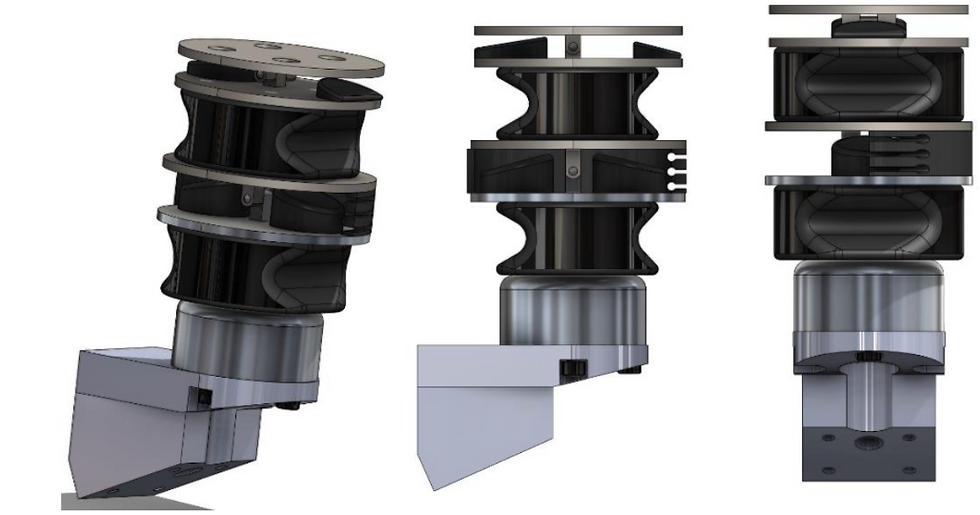
Figures 16a-c. V23 Model isometric view (a), side view (b), and frontal view (c).
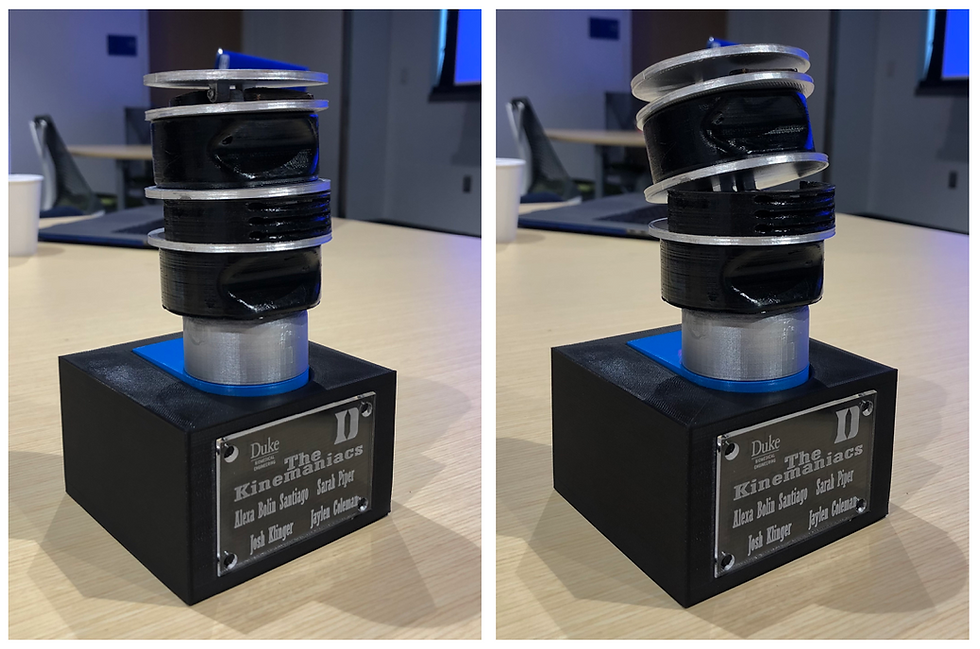
The final iteration of the SOK contains 14 individual components consisting of steel, aluminum, and butyl rubber. There are 7 deformable components, with 2 discs, 4 joint bumpers, and 1 buckling sleeve. Each of these components are individually adjustable in future iterations. In order to perform best in AP-bending and achieve free rotation of the head initially, two rotational joints have been implemented at the location of the top plate mating to the Hybrid III head and at the approximate cervical fulcrum at C3-C4 (Luck 2012, Manandi 2019). The top rotational joint is supported by two short bumpers, intended to compress in non-axial load cases upon head rotation to increase stiffness. The anterior bumper is shorter than the posterior bumper to allow further rotation in flexion than extension.
The upper cervical spine is modeled here as an asymmetrical disc for non-uniform behavior in AP-bending, similar to the middle section of the cervical spine. Between these two discs is the fulcrum rotational joint, shown with half of the buckling sleeve hidden to reveal the bumpers (Figure 16c). The bumpers of the lower joint are nearly the same height, with a sharper angle on the anterior bumper to allow slightly more rotation in flexion than extension. The buckling sleeve surrounds this joint with a thick solid section on the posterior side of the neck and a thin, slotted cutout section on the anterior side. This is intended to minutely increase stiffness in flexion-extension before buckling at the onset of moment induction. Although the sleeve is shown in a section view left/right, the sleeve is two separate deformable elements divided into front/rear which exhibit differing behavior.
Finally, the lower cervical spine is currently a rigid aluminum cylinder which mates to the middle cervical spine and the neck bracket, acting to limit overall deformable length and locate deformable elements higher in the neck, correlating with increased probability of UCS injury in a pediatric specimen (Luck 2012). Overall, this design follows the trending behavior in both time history and head/neck relative angle history in each of the loading cases, however it experiences both peak moments and angles too soon in the mechanical load testing.
Final Testing Methods
A variety of computational tests were utilized in analyzing our 6-year-old pediatric neck model. All of these tests were performed within the LS-DYNA software except for the scoring methods which were developed and run in MATLAB. Each of these computational tests gave a variety of data on the behavior of our model in different loading conditions and against our established biofidelic corridors. The six tests performed were tension, compression, flexion, extension, NBDL, and CHOP.
The directionality referred to below indicate head movement. Head movement along the x-axis can be attributed to forward (+) and backwards (-) translational motion. Head movement along the y-axis can be attributed to right (+) and left (-) rotational motion of the neck. Lastly, head movement in the z-direction can be attributed to vertical movement up (+) and down (-) by the neck. A combination of any of these three directions accounts for the bending characteristics of the neck and is detailed in bending or rotational tests such as flexion, extension, NBDL, and CHOP.
Tension
The tension test is a fixed-fixed test in which both the top and bottom of the model neck are fixed and thus unable to move; this set-up is representative of the physical testing apparatus in which both the top and bottom of the model neck are fixed to load cells in the head and torso, respectively. With the top plate acting as the connection between the neck and the load cell, this rigid connection constrains neck and head movement to be only in the z-direction for both tension and compression. The bottom plate serves the same purpose, but for connection with the load cell at the top of the torso through the lower neck bracket.
Figure 17. Tension testing apparatus configuration.
The tension simulation is run for 100 ms and oftentimes begins unloading behavior around 50 ms; the exact instant unloading occurs is dependent on a variety of factors, primarily neck stiffness. The run time of this test is able to be changed. Our team did not see any reason to increase the total time, but did decrease the time in order to take out the unloading portion of the curve and run more simulations in less time. For this test, unloading occurs when the neck has reached its maximum displacement and begins to return back to its initial position; this looks like the neck stretching and thinning out as it is pulled upwards, then compressing back to x=0 once it has reached its peak. The stiffness values in the tension test are measured at the top of the neck in order to capture the total tension from the neck bracket (fixed condition) upward, similar to the load cell mounted in the head during a crash test. Due to the simplicity of the tension test, this pure axial behavior would not naturally occur in a car crash, but serves as a tool for understanding the stiffness properties of the neck.
Compression
Similar to the tension test, the compression test is a fixed-fixed test in which both the top and bottom of the model neck are unable to move. The top plate connects the model neck to the head load cell while the bottom plate connects the model neck to the torso load cell.
Figure 18. Compression testing apparatus configuration.
The compression simulation is run for 100 ms and, similar to the tension test, begins unloading around 50 ms. In this test, the top load cell slowly compresses the model neck. The displacement between the top of the neck and the bottom of the neck decreases until reaching its minimum value, then increases back to x=0. With movement strictly in the z-direction, there is no analysis of forces or moments in the x- or y-directions for this test. The neck does not actually return back to its initial position due to a shortened run time, but this could be adjusted if the unloading data was deemed useful in our team’s analysis.
The compression test is also not naturally observed in frontal car accidents, but the observations and data obtained from this simulation can be helpful in understanding neck stiffness as well as how this stiffness relates to neck behavior in AP bending.
Flexion
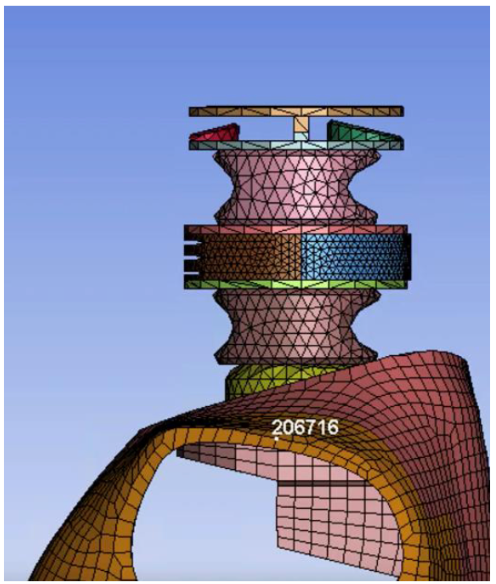
Figure 19. Flexion testing apparatus configuration.
To test the biofidelity of the neck in AP bending, the flexion test was fixed-free. The bottom of the neck was attached to the rigid lower neck bracket, and the top of the neck connected to the freely moving 6-year-old head. Force loading occurred purely in X (front) and Z (up down) direction. Estimated run time for the simulation was 180 ms. Unloading of the neck angle stars when the head makes contact with the torso. Motion of the head follows a defined curve creating moment angle in the neck. Representing the sudden stop of a vehicle where one’s head would jolt forward and an airbag would be needed to stop the chin from hitting the chest found in this test (no airbags in children seating).
Extension
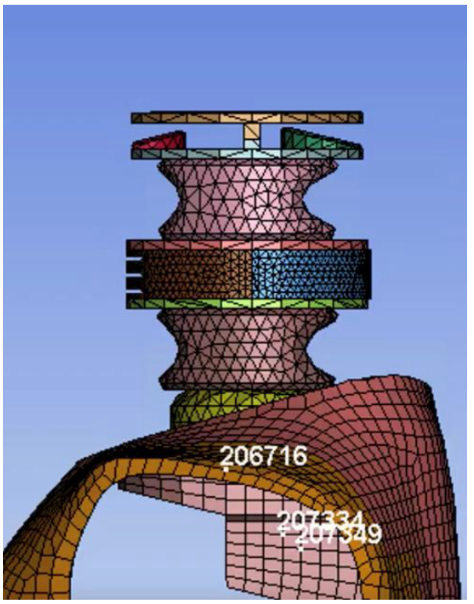
Figure 20. Extension testing apparatus configuration.
The extension simulation behaved similarly to the flexion test and was fixed-free neck. However instead of having the head move forward the head moves backwards. Movement occurs in the z direction and bends in the x direction (backwards), no movement in y direction. Each test was run for a 180 ms. The test measures force at the top of the neck. Extension motion simulates the head of a child after seatbelt restraint initiated in a car crash. The head would jolt backwards and reach full extension before hitting the car seat.
NBDL
The Naval Biodynamics Laboratory (NBDL) in New Orleans conducted a large number of human volunteer tests to study omni-directional head-neck response in an impact situation. The results of the data developed performance requirements for crash test dummies. For each simulation the models are arranged in an upright position and exposed to short duration accelerations for frontal collisions. The resulting three-dimensional motions of the head marked by anatomical landmarks define the Frankfurt plane, infraorbital notches and the auditory CG of the head. In the frontal impact test, the simulated 6-year-old torso is held restrained while the head and neck are able to move.
The fixed-free test was performed for 200 ms or until the peak x and z displacement was recorded. Unloading of the curve occurs when the head comes into contact with the chest from 100 to 160 ms. Peak acceleration of the NBDL model testing was 10 g in the x direction (Wismans 1984). The performance of the neck model is compared to the volunteer corridors with the same initial conditions to measure the head lag, head CG, x displacement, and z displacement, thus, simulating the behavior of the model in a moderate frontal impact.
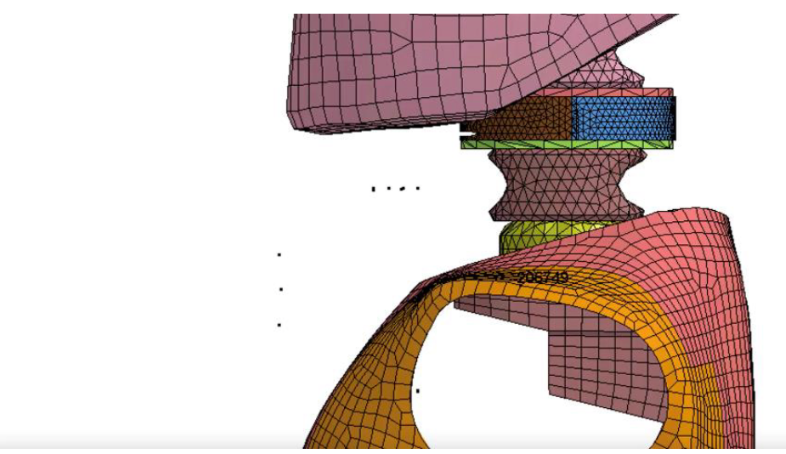
Figure 21. NBDL testing apparatus configuration.
CHOP
The Children Hospital of Philadelphia (CHOP) was a fixed-free neck test validated by using child and adult volunteers to create corridors tracking head movement. To simulate the condition of a low impact car crash, the base of the neck is fixed to the torso and the top of the neck is connected to the head allowing for free movement in the x/z direction. Acceleration and deceleration of the torso occur within a 500 ms timeframe with maximum acceleration being 3.59 g for children (Balasubramanian 2009). The acceleration models a frontal “pulse” using the double haversine function to smoothly increase the displacement to 5 mm and smoothly return to zero. Creation of the “pulse” models the kinematic head and neck movements volunteers experienced.
Head movement is tracked over time during 5 event phases: acceleration, restraint loading, rebound, coasting, and braking. Markers along the mid-sagittal plane along the x and z direction for nasion (NAS) and external auditory meatus (EAM) obtained anthropometric measurements of the head. An additional measurement recorded the head rotational velocity over time. The CHOP test is an accurate representation of low impact accelerations with reproducibility to better simulate the biofidelic response of a neck model. The testing apparatus below does not include in the head in order to see behavior of the top of our neck in CHOP; the head can be added back, if necessary.
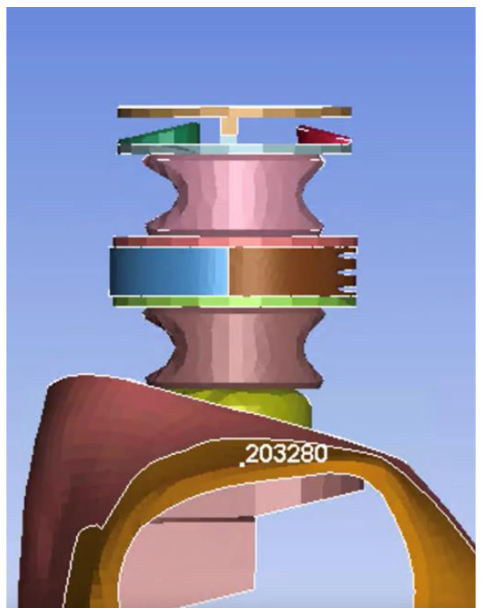
Figure 22. CHOP testing apparatus configuration.
Scoring Methods
To objectively rate the performance of our models, the Correlation and Analysis (CORA) grading metric measured the biofidelic response of the 6-year-old model necks. Commonly used in the field of injury biomechanics, the CORA grading metric effectively compares the results of each model to the corridor parameters of tension, compression, AP bending, NBDL, and CHOP (Gehre 2009). The CORA algorithm uses two different methods to evaluate the correlation of the model to specific parameters. For each of the grading metrics the score ranges from “0” indicating no correlation to the highest score of “1” representing a perfect match.
Method 1 directly calculates the deviation between the boundaries of the corridor to the fit of the computational model. The compliance with the corridors is calculated for each time step. The final rating of a model is the average of all single time step ratings. Method 2 takes a cross correlation approach to analyze specific curve characteristics of the corridor such as the phase shift, size, or shape of the model response. Each of the sub-methods have individual weightings factors. First, the phase shift measures the distance between point-to-point differences of the corridor to the model. Secondly, size compares the magnitude of each point. Thirdly, the shape of the corridor is a comparison of the area under of the curve. CORA provides not only a rating of a single pair of curves, but the rating of all sub-method cases are merged together for an overall global rating of the model's performance.
Method 1 was used for testing the behavior of the neck model in AP bending, NBDL, and CHOP. Scoring of AP bending was a combination of scoring the model’s behavior in extension and flexion. The fit of the model was compared to the validated Mertz corridor of rotation of the neck with respect to the corresponding moment. Additionally, model fit within the corridor of peak angle and moment was graded from 0 to 0.5 while time was graded from 0 to 0.5 for a maximum score of 1. NBDL followed a similar approach for the head lag and head CG of model fit to the characteristics of the corridors. Peak head CG timing in the x and z directions scored from 0 to 0.5 while time was graded from 0 to 0.5 for a maximum score of 1. Scoring for CHOP in all metrics utilized the corridor method to determine model fit within the verified corridors.
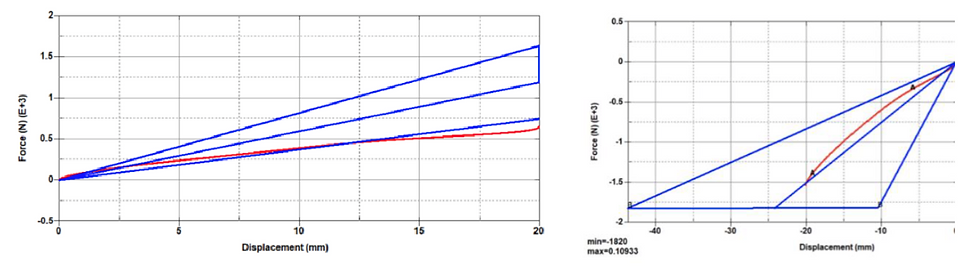
Method 2 was used to test the properties of the model while in tension and compression. The differences at the model’s greatest displacements were weighted higher than at minimal displacements in phase shift grading, shown in Figure 23a. Size scoring, as seen in Figure 23b, prioritized the relationship of the model fit to the middle of the corridor. Shape scoring compared the area under the curve of the model to the area of the corridor midline. Each of the three sub-methods were graded from 0 to 1 and added together to have a maximum score of 3 in tension and compression.
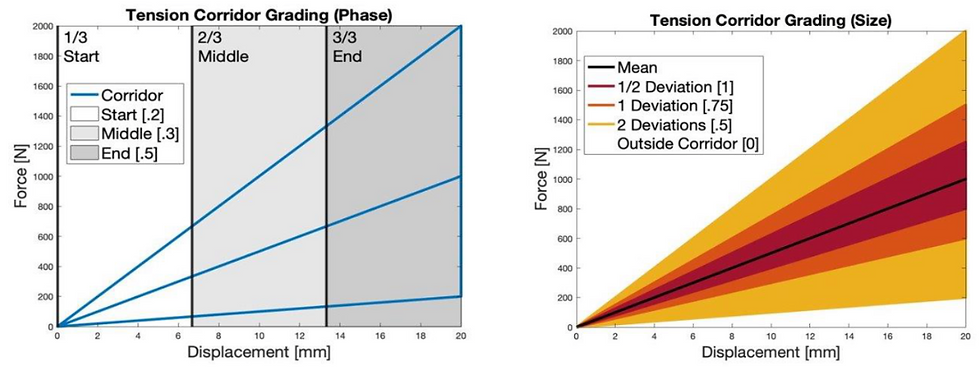
Figure 23a-b. Tension phase shift grading method (a) and tension size grading method (b).
An advantage of the corridor method is the simplicity to determine a positive or negative correlation within the corridor. However, a primary limitation of the CORA grading metric is the width of the corridor. If too wide, the corridor greatly increases the number of “1” ratings of the correlation making it harder to distinguish between poor and fair correlations to accurately model the biomechanics of the 6 YO neck. In contrast, corridors that are too narrow are more likely to have “0” ratings. Due to this, a model that moderately resembles the behavior of the neck would not be appear to have a bad correlation. The cross-correlation method avoids the disadvantages of the corridor method by comparing and analyzing key features of the corridors. With having three additional sub-tests, the complexity of the scoring increases as well as the margin for error.
Final Testing Results
Tension
In tension, our model was in the corridor for a bit under half of the total displacement (Figure 25). This result was not what we expected going into the simulation as none of our prior versions saw as much nonlinear behavior as well as such high stiffness with only butyl rubber in the deformable regions. However, upon watching the simulation, it was clear that with the addition of the second rotational joint, our model was much more sensitive to the asymmetry of the disc design (Figure 24). Although we had not planned on engaging the sleeve in tension, this rotation led to the gradual engagement of the sleeve in both the anterior and posterior sides, which stiffened our neck and led to the nonlinear behavior observed.
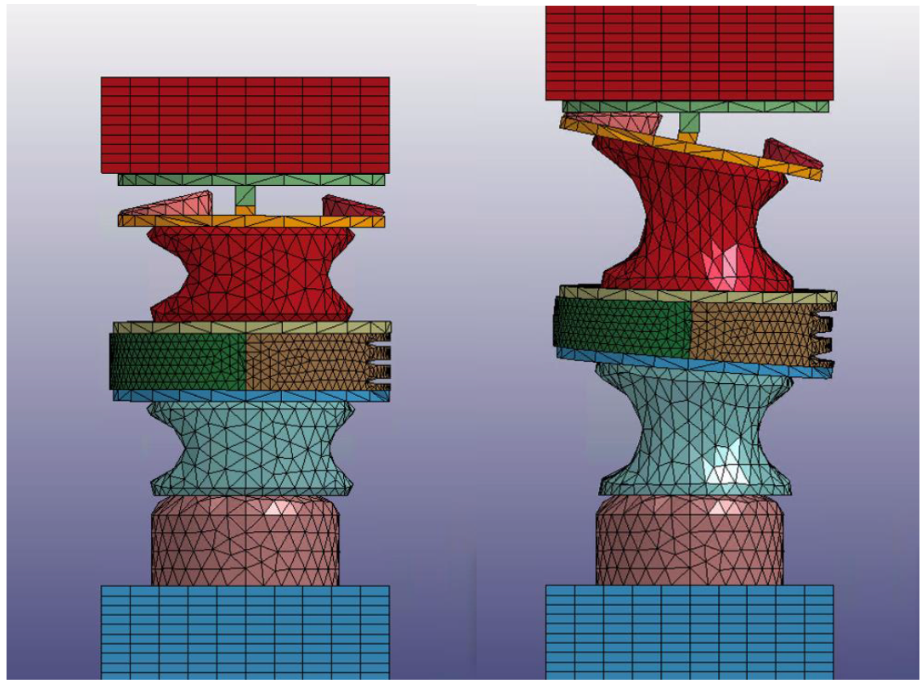
Figures 24a-b. V23 in tension.
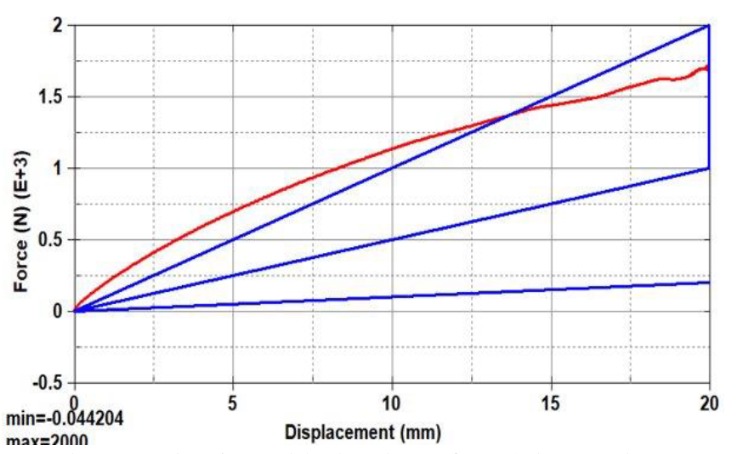
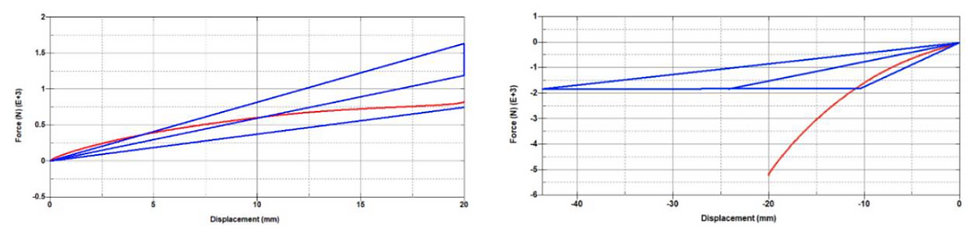
Figure 25. Plotted behavior of V23 in tension.
Compression
The asymmetry of the discs also affected our results in compression. Due to the asymmetry of our discs, there began to be rotation of the middle joint as a compressive force was applied, resulting in the nonlinear behavior in compression (Figure 27). This led to a progressive rotation and increased force on the sleeve, which is a thin component that is not meant to undergo any large forces. Because of this, there is buckling of the sleeve observed in compression, which leads to the oscillation at the end of the compression curve (Figure 26).
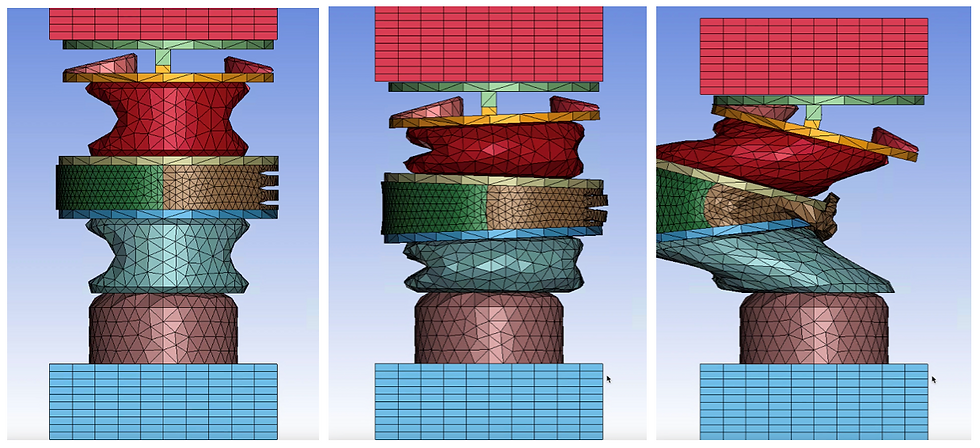
Figure 26a-c. V23 in compression.

Figure 27. Plotted behavior of V23 in compression.
Flexion
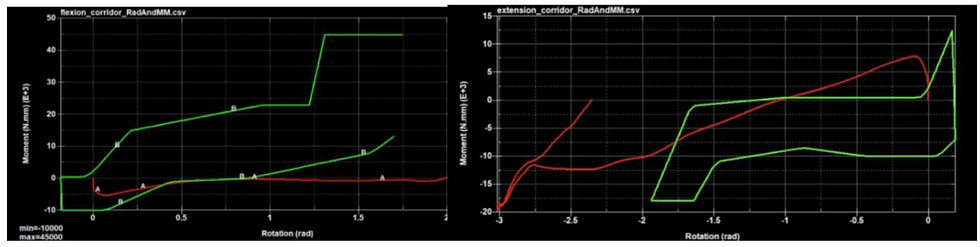
In flexion, the model observed the expected behavior, with the gradually induced moment the design was meant to achieve (Figure 29a). Due to the addition of the sleeve, as the neck bends, the individual slits are engaged in compression (Figure 28). However, there was still not enough moment induction at the later end of the curve. Compared to our prior versions V10 and V14, we actually did not perform as well flexion. This is a point for potential future improvement, as we could replace the rigid LCS portion with a chloroprene disc like we had done for those versions.
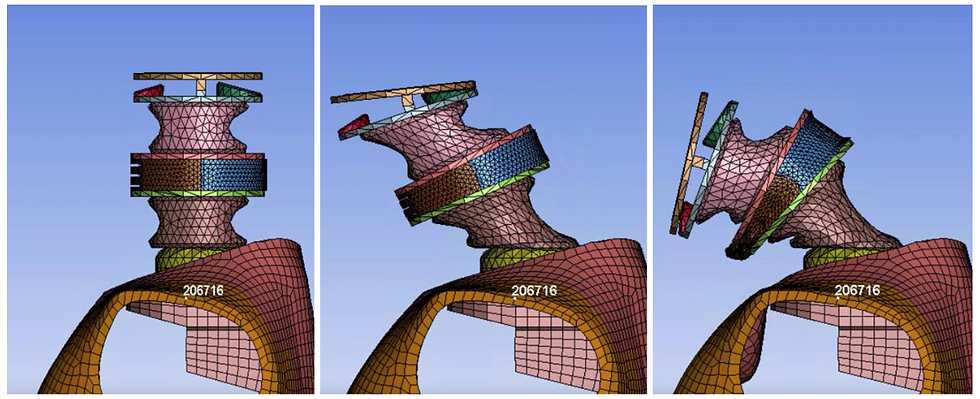
Figure 28a-c. V23 in flexion.

Figure 29a. Plotted behavior of V23 in flexion (Mertz corridor).
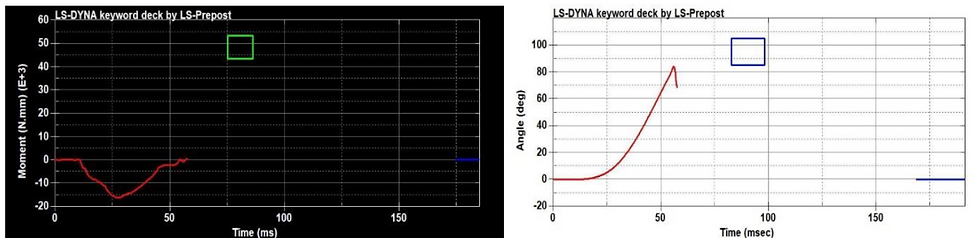
Figure 29b-c. Plotted behavior of V23 in flexion (Moment/Angle-Time).
Extension
In extension, we saw the correct behavior and reached the correct maximum angle of rotation. However, the rate at which the model stiffened as it rotated was too slow initially (Figure 31a). This could be corrected by making the sleeve thicker or using a stiffer material as was described in flexion. Again, the sleeve is buckling under high compressive forces, which is significantly lowering the moment it was designed to contribute (Figure 30c).

Figure 30a-c. V23 in extension.
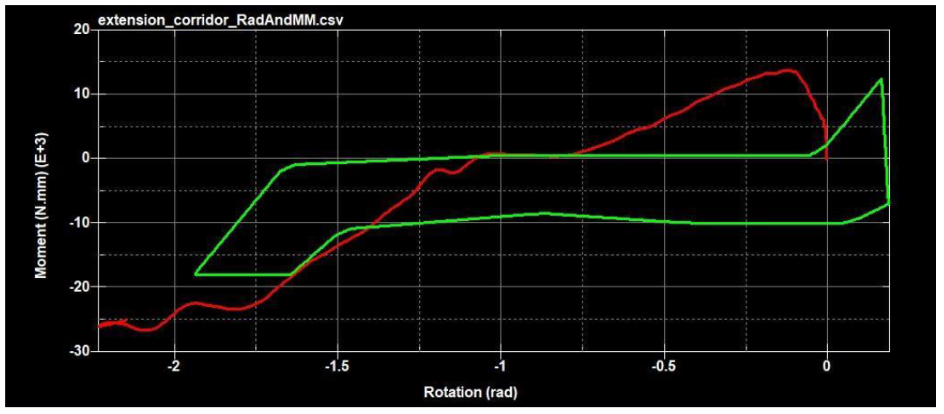
Figure 31a. Plotted behavior of V23 in extension (Mertz corridor).
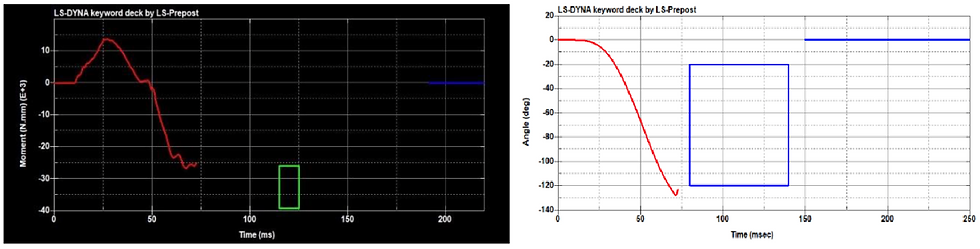
Figure 31b-c. Plotted behavior of V23 in extension (Moment/Angle-Time).
NBDL
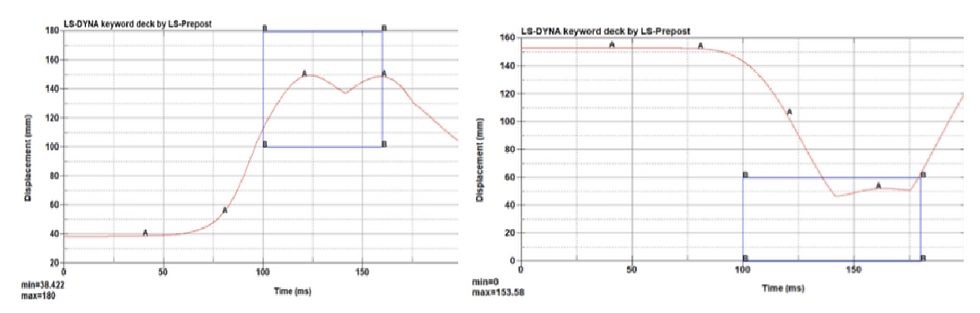
NBDL performed exceptionally well as it was the team’s main focus of all the performance specifications. The head CG behavior of the Hybrid III is not accurate as it experiences significantly more x than z displacement. Our model reduced the x displacement and achieved accurate displacement in the z-direction as well as the correct overall behavior. Head lag was another key focus of the team. The Hybrid III does have the three distinct portions that the head lag curve is characterized by. The 6-year-old neck should first exhibit high neck angle, then high head angle, and finally a linear relationship between head and neck angles. Our model was able to capture these three stages that the Hybrid III lacked, although it could still use improvement in making the final stage occur sooner. The timing of the maximum x and z displacement was also captured accurately in this test.
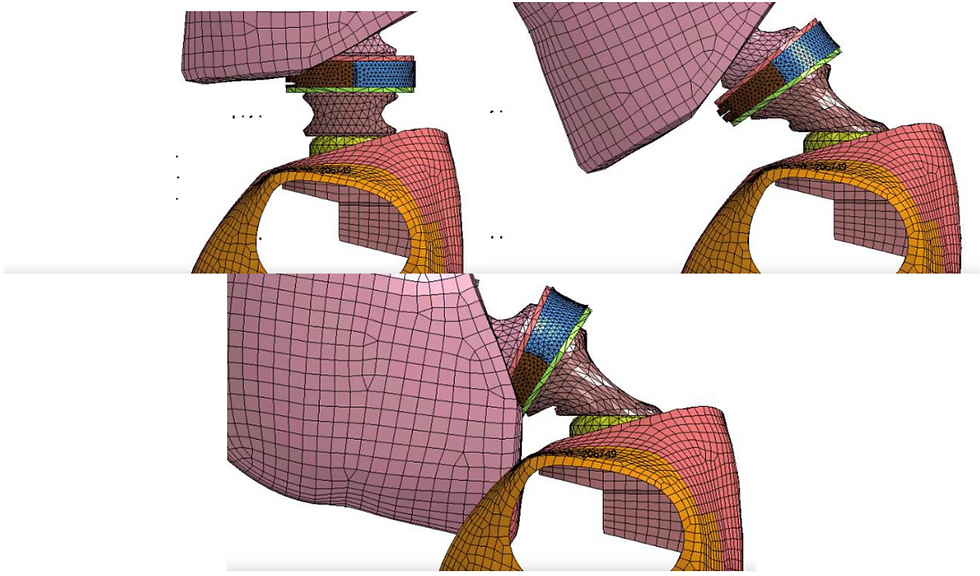
Figure 32a-c. V23 in NBDL.
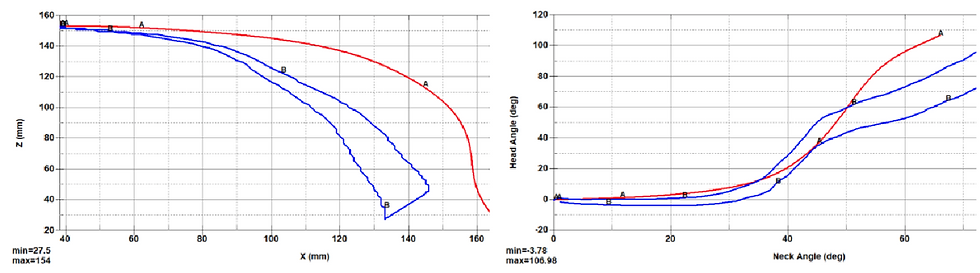
Figure 33a-b. Plotted behavior of V23 in NBDL (Head CG and Head Lag).
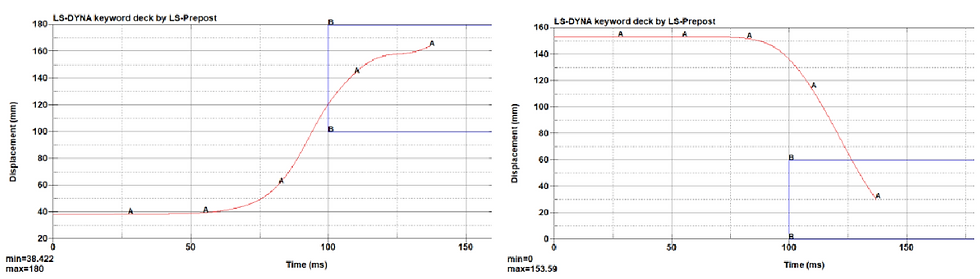
Figure 33c-d. Plotted behavior of V23 in NBDL (X Displacement/Z-Displacement -Time).
CHOP
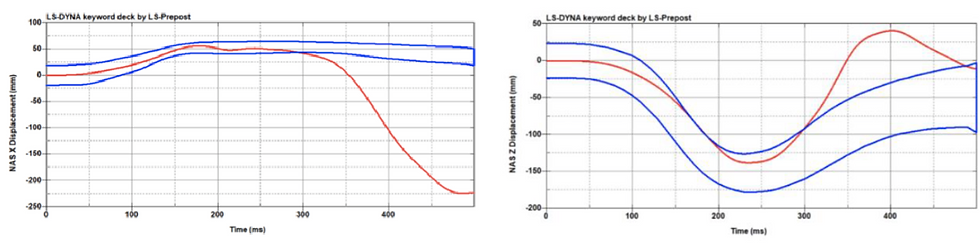
Lastly, the CHOP test was conducted, in which the model performed better than the Hybrid III. This was expected as it is similar to the head CG test in NBDL, looking at the x and z displacement of the neck in bending. The CHOP test records largely time history data, which our model follows fairly closely to the time corridors here as opposed to in A-P bending. One potential area for improvement is the buckling in the anterior portion of the sleeve, as can be seen in Figure 34b.
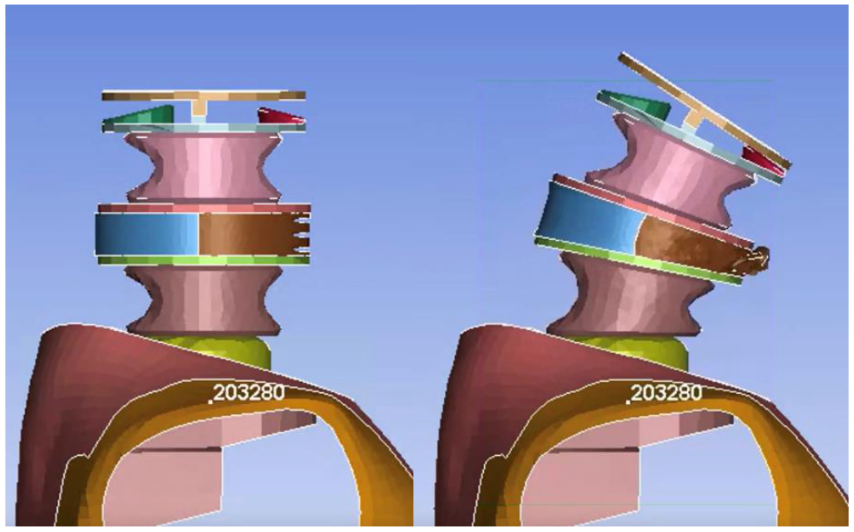
Figure 34a-b. V23 in CHOP.
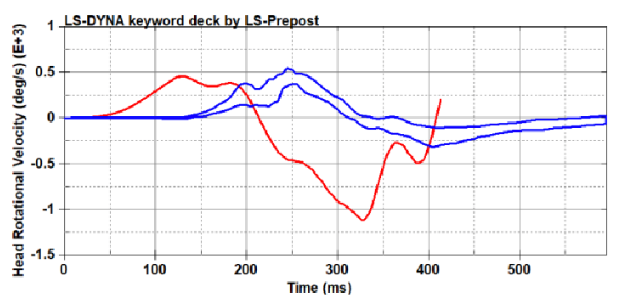
Figure 35a. Plotted behavior of V23 in CHOP (Head Rotational Velocity-Time).
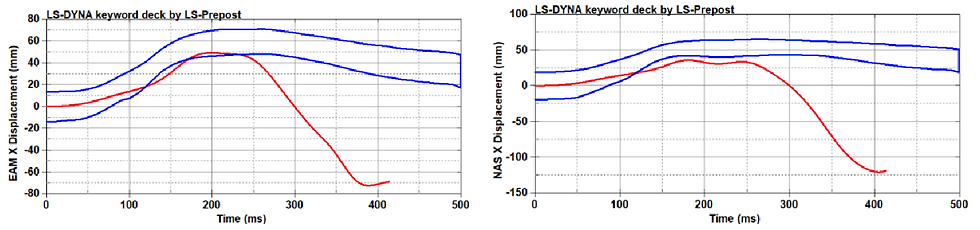
Figure 35b-c. Plotted behavior of V23 in CHOP (X Displacement-Time).
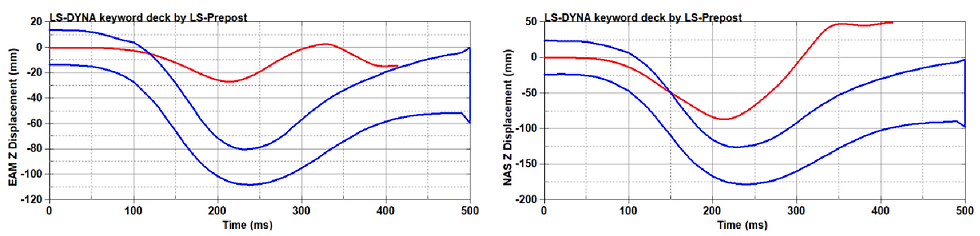
Figure 35d-e. Plotted behavior of V23 in CHOP (Z Displacement-Time).
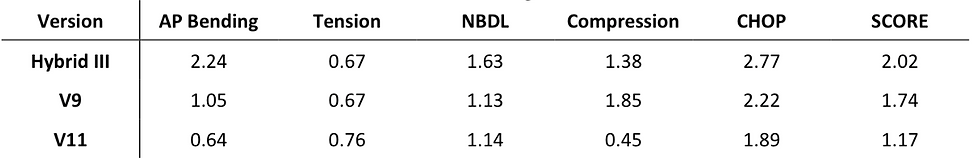
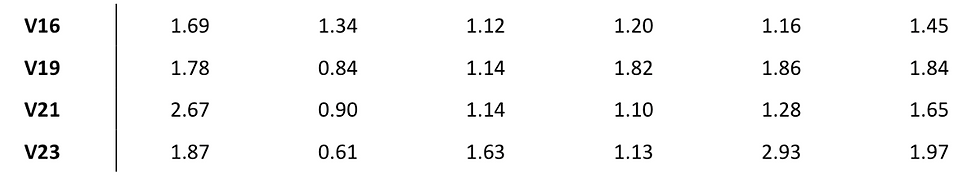
Scoring of Key Iterations
Although the Hybrid III model scores slightly higher than our final V23, in areas of biofidelic importance the neck performs better than the industry standard. The addition of two rotational joints allows the neck to improve in CHOP scoring and especially in head lag and head CG location. A tradeoff however is the decrease in tension scoring due to less deformable material available and greater stiffening of the model neck. Future iterations of the neck model aim to improve the linear functionally of the tension and compression corridors by making the discs more symmetrical. Another area of focus is to reduce the stiffness in the bottom of the neck to increase the duration to the moment/angle peaks in flexion and extension by adding an extra disc composed of chloroprene rubber.
Table 8. Scoring results.
Design Iterations
Hybrid III
The original Hybrid III model includes uniquely shaped cut-outs both on the front and back sides of the neck. The front side of the model (left side of Figure 36) includes both triangular and circular cut-outs while the backside (right side of Figure 36) includes only circular cut-outs. The neck is all one material and was modeled in butyl rubber.
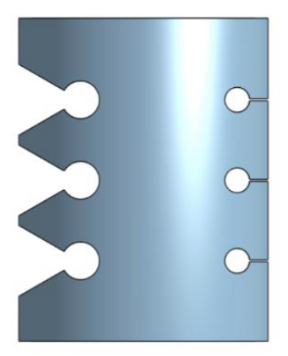
Figure 36. Hybrid III 6YO CAD model.
All six tests were run on this model. The tests found successful within our class corridors were compression, head lag (NBDL), NASX (CHOP), and NASZ (CHOP).
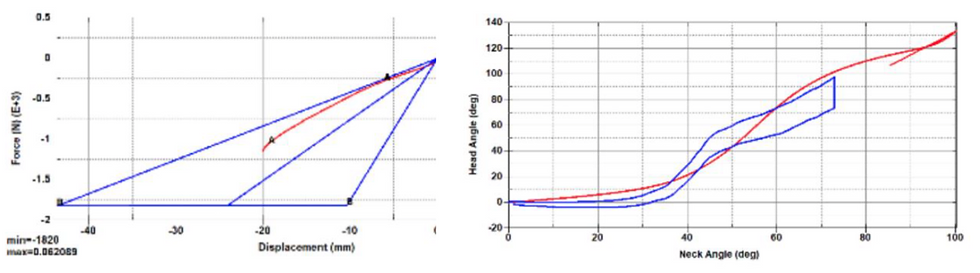
Figure 37a-b. Hybrid III 6 YO results in compression (a), and head lag (NBDL) (b).
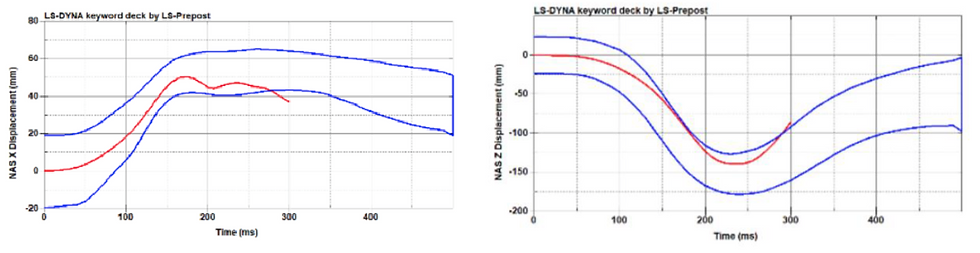
Figure 37c-d. Hybrid III 6YO results in NASX (CHOP) (c), and NASZ (CHOP) (d).
Rejections and improvements were not made from the Hybrid III model, but results were used as a base for the beginning of our design process as well as later comparison for our prototyped neck.
V1: Our First Iteration
Our first prototype includes a compilation of many of our brainstormed features such as rigid metal plates, rubber disks, and cut-outs present in the rubber disks (Figure 38). Many of these ideas came from observations made on the Hybrid III model neck above. The rubber disks were off-centered in this iteration; this was another design feature we wanted to look into. This model utilized the existing nodding plate, but in future iterations our team decided to use the entirety of the overall length available.

Figure 38. V1 CAD model.
All six tests were run on this model, but the only test we found successful for this version was compression. This prototype was a great starting point to get our ideas into a model that we could work from in future iterations.
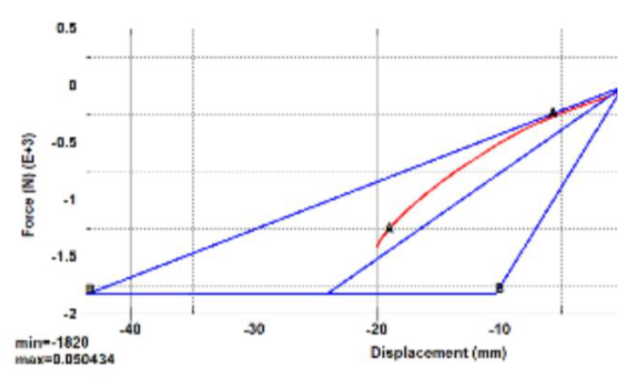
Figure 39. V1 results in compression.
From these results, our team decided to start by refining the moment induced in AP bending by means of adjusting the diameters of the rubber disks. The addition of minor cut-outs in the rubber disks were also explored as a means of producing a greater moment in AP bending.
V4: Larger LCS Diameter than UCS Diameter
Our next major iteration focused on making the diameter of the lower cervical spine (LCS) larger than the diameter of the upper cervical spine (UCS) in order to produce a higher moment in AP bending; this would make the bottom stiffer than the top, thus, aiding in rotational motion when the head angle is larger (Figure 40). Thicknesses of the metal plates and rubber disks as well as cut-out sizes were altered in between, but gave expected results. Increasing cut-out sizes and increasing the amount of rubber in comparison to metal were both found to decrease neck stiffness.
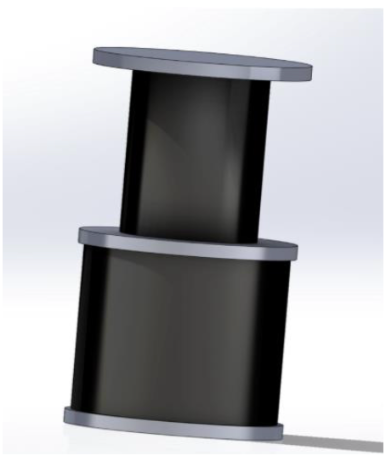
Figure 40. V4 CAD model.
All six tests were run on this model, but the only test we found somewhat successful for this version was CHOP. With this model still not providing a moment in AP bending, we concluded that the diameter of the LCS was not significantly different than the UCS or the diameter of the UCS was not large enough and therefore was not producing the results we needed (Figure 41a/b).
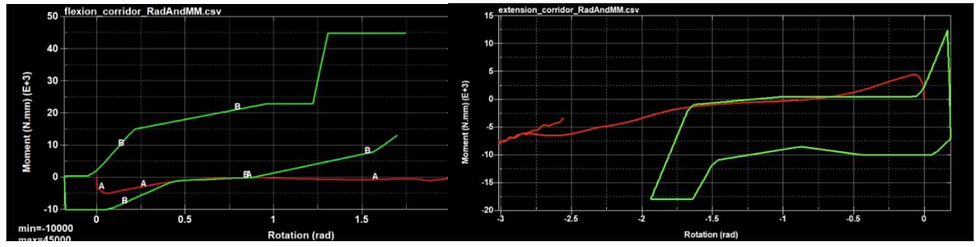
Figure 41a-b. V4 results in flexion (a), and extension (b).
From these results, we decided to iterate through a few different versions with significantly different UCS and LCS diameters. As we will see, this oftentimes altered the fulcrum location in AP bending and allowed for greater rotation.
V7: Larger UCS Diameter with Same LCS Diameter
The major change we made in this iteration was making the UCS diameter significantly larger than it was in V4 while keeping the diameter of the LCS the same; this change was made to continue our efforts in producing a greater moment in AP bending. The metal plates were also thickened in order to increase neck stiffness.
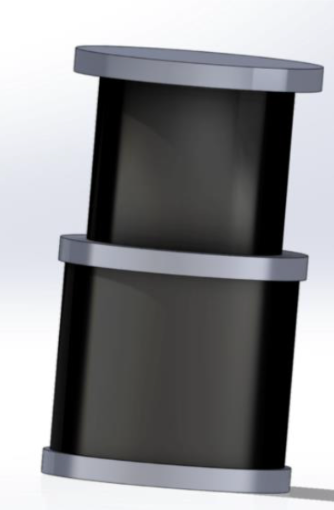
Figure 42. V7 CAD model.
All six tests were run on this model, but the only test we found successful for this version was compression. Unfortunately, a considerable moment was still not produced in flexion which was our main focus of increasing the UCS diameter although the moment is found to increase considerably in extension (Figures 43a/b).
Figures 43a-b. V7 results in flexion (a), and extension (b).
From these results, we decided to look into implementing different shaped cut-outs in the rubber disks in order to produce a higher moment in AP bending. We also wanted to look into different material stiffnesses and how the use of different materials may affect the stiffness of our neck in both tension and compression.
V8: Use of Chloroprene Instead of Butyl Rubber
As we started doing material tests, our team decided to use chloroprene rubber in our first modification because, based off of its material properties, we believed this would allow for a stiffer neck. We decided to replace both the UCS and LCS rubber disks with this new material in place of the butyl rubber that was there before. Due to chloroprene’s higher stiffness values, we expected the neck to be stiffer in both tension and compression. The model design was exactly the same as V7 other than the change in material properties stated above (Figure 42).
The only tests run for this version were tension, compression, and flexion as we were primarily interested in how the change in material would affect neck stiffness. In addition, we assumed any other test results to be insignificant after obtaining the tension and compression results. We were a bit shocked at how significant the use of chloroprene rubber changed our results and set aside working with different materials for a while as we refined other aspects of our design.

Figure 44a-b. V8 results in tension (a) and compression (b).
From these results, we concluded that the use of chloroprene rubber in both the LCS and UCS contributed to a neck that was way too stiff and far outside of the range established by our corridor (Figure 44a/b). Due to this, our team decided to continue working on ways to decrease neck stiffness while avoiding a change in materials for now. Our next steps were focused on extrusions (sections larger than the cut-outs used in the Hybrid III) into the UCS and LCS rubber disks in order to decrease stiffness (less material) and produce a greater moment in AP bending.
V9: Single Extrusion into UCS
In this iteration, the major change implemented was the addition of a single extrusion into the UCS rubber disk. As stated in the section above, this was done in order to decrease neck stiffness and produce a greater moment in AP bending. The circumferences of the UCS and LCS rubber disks were made uniform in this version to better visualize any significant result made by the single extrusion on the overall design; this means we made the diameters of the rubber disks the same as that of the metal plates.
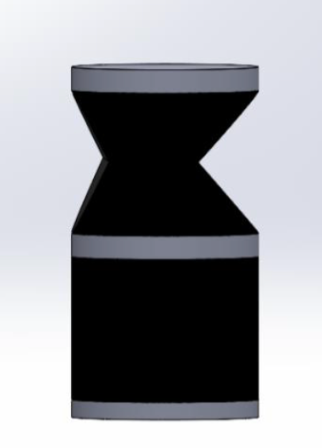
Figure 45. V9 CAD model.
All six tests were run on this model, but the only two tests we found successful for this version were compression and head lag (NBDL). Although neither flexion or extension were within our corridors, we did observe a slightly increased moment in flexion than we found in previous iterations as well as a more distinct increase in moment in extension; this gave us hope that the method of extrusion into the rubber disks was one to explore further (Figures 46b/c). Head lag was not a test we were specifically looking at, but we have noted that this model was one of our most successful in head lag and would like to explore this result further as well (Figure 46d).
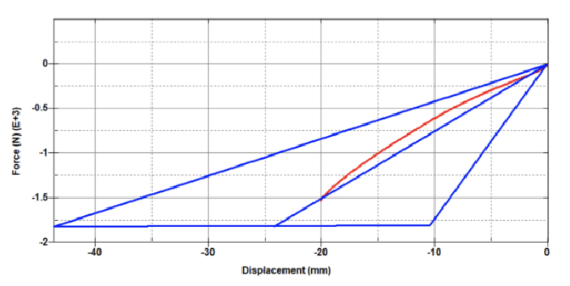
Figure 46a. V9 results in compression.
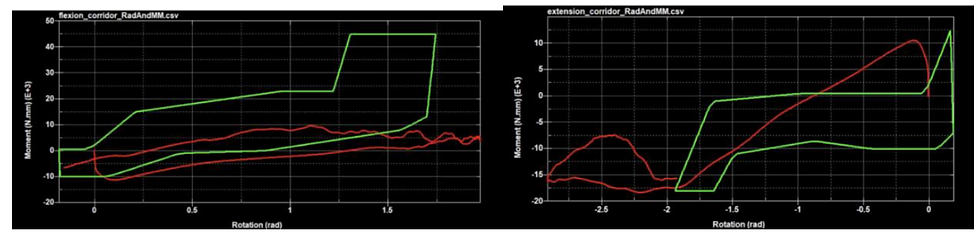
Figure 46b-c. V9 results in flexion (a) and extension (b).
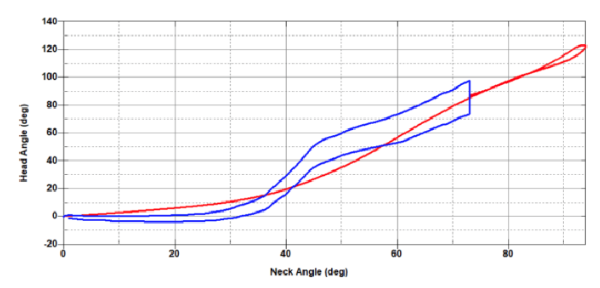
Figure 46d. V9 results in head lag (NBDL).
From these results, we decided to brainstorm ideas for the shape and size of our extrusion into the rubber disk in order to better understand what the main factors are in producing a greater moment in flexion. Our assumption is that less material and a sharper angle for the extrusion would aid in increased rotational motion and a more deformable neck so we decided to add another extrusion in the LCS.
V10: Extrusion in Both UCS and LCS
With two extrusions instead of one, V10 is very similar to V9 in every other way. No other changes were made between these two iterations other than using chloroprene rubber for the LCS and butyl rubber for the UCS. In hind sight, it would have been beneficial for us to break up these changes into two different iterations in order to assess the results from each change separately rather than as one.
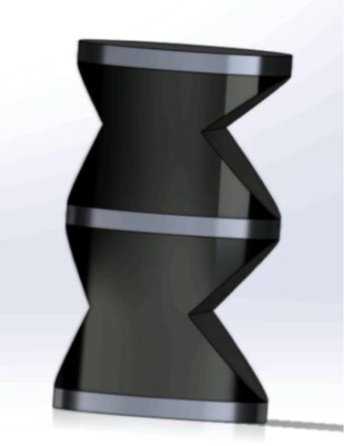
Figure 47. V10 CAD model.
All six tests were run for this model with the tests found successful being tension and NBDL (head CG and timing) as well as a notable increased moment in flexion. We assume the non-linearity in the tension plot to be associated with the difference in materials between the UCS and LCS, but are still content as the entire curve is within the corridor (Figure 48a). Additionally, although the curve for flexion is below the corridor, the moment produced was the greatest yet and matched the general shape of the corridor up until 1.25 radians (Figure 48b). We found this iteration to be very significant due to this result and will continue with the double extrusion in further iterations. NBDL was also notable for its head CG and timing, but we were not focusing on this aspect of the design and therefore did not evaluate it too closely (Figure 48c-e).
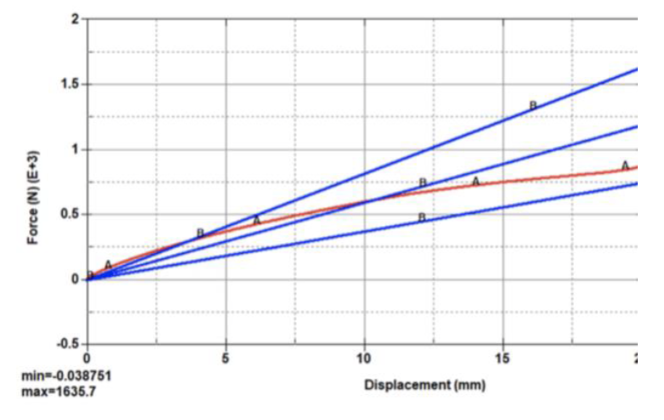
Figure 48a. V10 results in tension.

Figure 48b. V10 results in flexion.
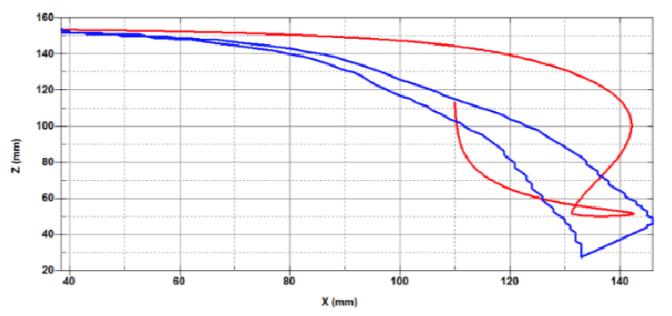
Figure 48c. V10 results in head CG (NBDL).
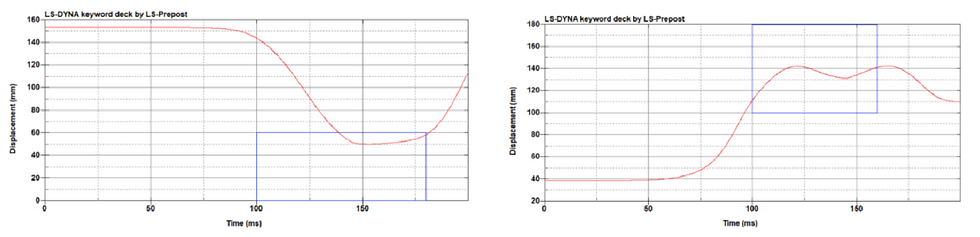
Figure 48d-e. V10 results in head CG timing (NBDL).
From these results, our team’s next steps will be to look into taking even more material away from the rubber disks in order to play with the stiffness values while also trying to induce a greater moment in flexion.
V12: Hourglass Figure to Remove More Material
The major change made in this iteration was the removal of rubber material in the disks into a more hourglass shaped figure in order to induce a higher moment in AP bending (Figure 49). The UCS and LCS are both butyl rubber and the design includes a higher “joint” relative to the center of the disk. Our main goal in this iteration is to induce a greater head lag and increase the moment in AP bending. The metal plates are still aluminum and are 6 mm in thickness.

Figure 49. V12 CAD model.
All six tests were run for this model with the tests found successful to be EAMZ, NASX, and NASZ (CHOP). This model was too deformable in both tension and compression telling us that the lack of material affected our stiffness values more than we wanted. When looking at the behavior in AP bending, no moment was produced; this was not what we expected as we hoped the hourglass figure would have a greater speed in head rotation.
From these results, what we clarified most was the idea of moment in bending and how we can increase this. Originally, our team was under the impression that a greater rotation speed would provide a greater moment, but through this iteration we’ve found this is the opposite. Due to a greater moment being produced when the stiffness is greater, a decrease in rubber material would take away from this stiffness during bending and contribute to a lack of moment in both the flexion and extension tests. In addition, the success of the CHOP tests showed us that the head is in an ideal position with bending in both the x- and y-directions. Moving forward, we’d like to keep a greater amount of rubber material in both sections and look into other ways to influence AP bending behavior.
V14: V10, But Oriented Front-Back
There is no change to this iteration in comparison to V10 other than the testing orientation. V10 was accidentally run with the cut-outs being on the right and left rather than the front and back; this was not our original plan, but did give valuable results so we decide to keep it as an important iteration (Figure 50). It was because of this misorientation that we decided to run V12 in an hourglass figure as all sides would have “cut-outs” affecting the model’s behavior in AP bending. In this iteration, the cut-outs are oriented in the front and back with the larger ones being in the front; this will allow us to understand AP bending for extrusions in the LCS and UCS as V10 did not perform in the way we originally wanted it to.
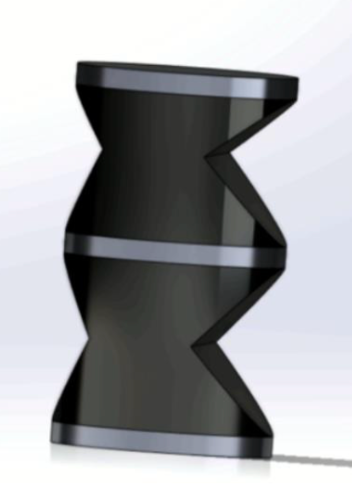
Figure 50. V14 CAD model.
All six tests were run for this model with the tests found successful being tension and head CG timing (NBDL). In addition, the head CG (NBDL) is closer than other iterations and the moment in flexion is slightly too deformable, but is closer to being within the corridor (Figure 51b). In comparison to V10, many of these testing results were very similar to one another making our group brainstorm reasons for why this would be the case. With both following general trends in flexion and extension, our thought was that a section with less material in the outer region spanning out from the base could be beneficial.
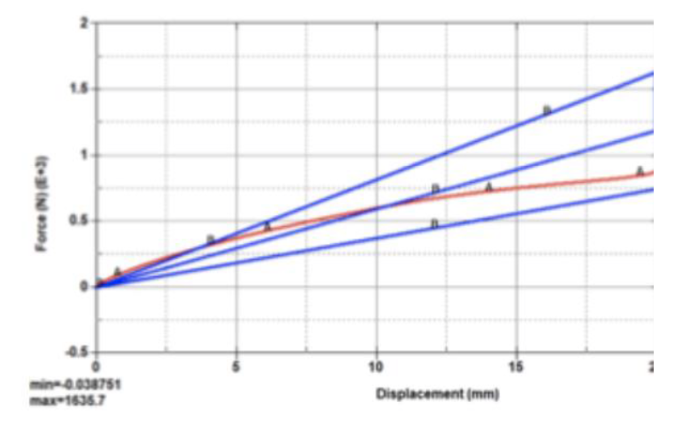
Figure 51a. V14 results in tension.

Figure 51b. V14 results in flexion.
From these results, we know that we’d like to look into a rotational joint. With a rotational joint, we would be able to freely induce bending while increasing the stiffness needed to induce a moment by means of the LCS and UCS material properties. To get this additional section, our next iteration looks into a three-section model in order to better understand the properties of this design before adding a joint in the middle section.
V17: Three Sections Instead of Two
The major change made in this iteration was the addition of a third section of the cervical spine rather than the simple UCS/LCS initial model with two sections (Figure 52). With this being said, this model contains 3 rubber disks and 4 metal plates. The metal plates were set to be steel instead of aluminum in order to increase the overall mass of the neck and the bottom rubber disk of the three was chloroprene rubber while the other two were butyl rubber. In addition, the heights of each section had to be significantly decreased in order to meet the height constraint set by the testing apparatus.
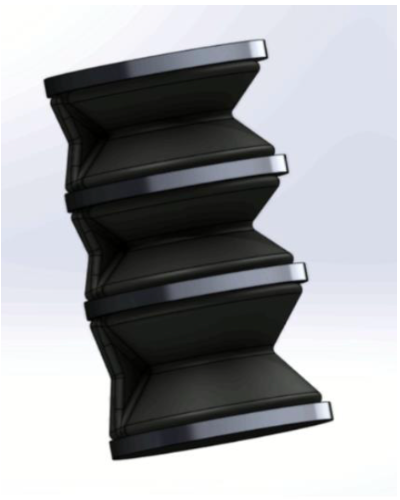
Figure 52. V17 CAD model.
All six tests were run for this model with the tests found successful being tension, compression, and the timing of our head CG (NBDL). This model was one of the first ones that was within the corridor for both tension and compression, giving us hope that our efforts in stiffening the neck by means of material properties and rubber disk thicknesses were working. The challenge for our team now was to preserve these stiffness properties in tension and compression while working to further improve our neck’s moment in AP bending.
Figures 53a-b. V17 results in tension (a) and compression (b).
Figures 53c-d. V17 results in head CG timing (NBDL).
From these results, we concluded that there is a significant amount of non-linearity in our stiffness curves (tension and compression) due to the additional section, but for the moment, do not see any problems with this. We would like to continue iterating through designs with three sections as we believe this is most representative of the actual neck, but will revert back to the two-section design when evaluating new features; this will allow us to better visualize the effects caused by those changes since we have less knowledge about how the three-section model performs. In our next iterations, we would like to explore the effects of different types of joints on our neck design, namely the translational and rotational joints.
V18: The Translational Joint
Our team’s utilization of the translational joint was not successful by itself, but provides us with important information on the behavior of the joint as a whole. The translational joint was created from V11 as our base (two-section model), but includes a cut-out of the LCS where the translational joint was implemented (Figure 54). The metal plates were kept as steel in order to increase the overall mass of the neck and the rubber disks were set to be butyl rubber in order to decrease runtimes for this iteration. From these changes, we expected a decrease in neck stiffness, but believe this is something we can increase later on. The main purpose in this iteration was to understand the behavior of the translational joint on our neck design.
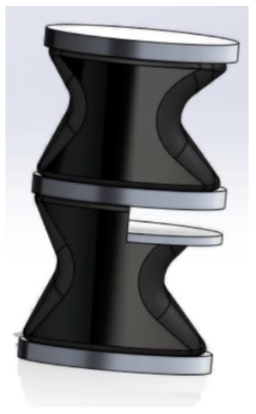
Figure 54. V18 CAD model.
All six tests were run on this model, but the only tests we found successful were compression, NASX (NBDL), and NASZ (NBDL). Neck stiffness in compression was very close to our ideal value, but tension was found to be too deformable, as expected (Figure 55a/b). Unfortunately, we did not see a moment produced in flexion for this iteration, but do see the usual moment in extension. Additionally, although we were not focusing on the NBDL or CHOP tests, the NASX and NASZ results up until 300 ms surprised us by how well they fit our corridors.
Figures 55a-b. V18 results in tension (a) and compression (b).
Figures 55c-d. V18 results in NASX (CHOP) (c) and NASZ (CHOP) (d).
From these results, we decided not to use the translational joint as it did not provide as much head rotation in NBDL as the rotational joint did. Moving forward, we will use the rotational joint in order to assess further behavior of our model and refine its motion in NBDL.
V19: The Rotational Joint
Our team’s utilization of the rotational joint made use of the V11 disk modeling with the implementation of a simple rotational joint between the LCS and UCS (Figure 56). Bumpers are located in the front and back of the neck in order to increase stiffness with a larger bumper in the back to aid in producing greater stiffness in extension than in flexion. The rotational pin has a 3 mm diameter and is 18 mm long; this section is covered along the entire length of the pin by a sleeve to maximize the tear out area in double shear. All plates are now steel instead of aluminum and both disks are still butyl rubber.
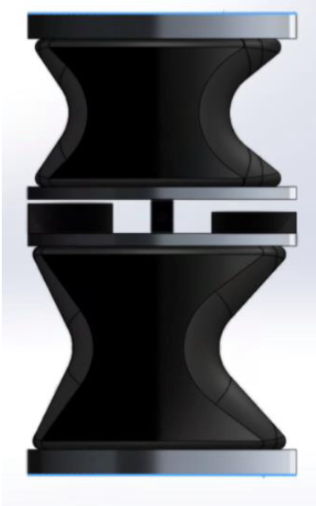
Figure 56. V19 CAD model.
All six tests were run on this model with the successful results coming from compression and NASX and NASZ (CHOP) with tension being slightly too deformable, but within the corridor when using a coarser mesh. The tests in flexion and extension were not significantly different than past iterations, but the success of the CHOP tests gave us hope that the head was in a better position than it has been in the past (Figures 57c/d).

Figures 57a-b. V19 results in tension (a) and compression (b).

Figures 57c-d. V19 results in NASX (CHOP) (c) and NASZ (CHOP) (d).
From these results, our team would like to iterate through a few different versions with the rotational joint in order to refine our moment in AP bending. We will do this by adding the rotational joint to the three-section model used in V17 as well as moving the more deformable section (UCS, rotational joint, and LCS) to a higher position on the neck.
Validation Results
Convergence Study
In order to determine if the mesh size used for our analysis was appropriate and led to reliable results, a convergence study was conducted on the deformable elements in tension. The simulations were run at a standard mesh size of 6 mm for the discs and bumpers and 4 mm for the sleeve components. For the convergence study, mesh sizes of 4 mm/ 2 mm and 2 mm/ 1 mm were used for the discs/bumpers and sleeve components, respectively. The results indicated that the maximum force experienced actually decreased once the mesh size was decreased by 0.67 (4 mm/ 2 mm mesh sizes) and plateaued for smaller mesh sizes (Figure 58a). The run time was not affected significantly by this change in mesh size as it only increased by 6-7 minutes (Figure 58b). Therefore, the team determined that the scale factor of 0.67 would lead to the most reliable results while achieving a reasonable run time.
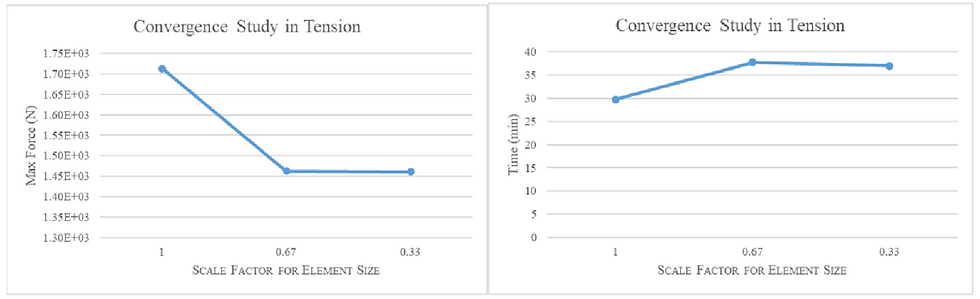
Figures 58a-b. Convergence study results (scale factors and run time).
For future consideration, the team would like to run a convergence study in flexion, as this is the test that engages the cutouts in the front of the sleeve which are the smallest deformable feature in the model.
Von Mises Stresses
The Von Mises stress is used to predict yielding of materials under complex loading from the results of uniaxial tensile tests. Surpassing the yield of a material results in permanent deformation. Overall, the maximum tensile stress encountered in the V23 model occurred in the butyl rubber sleeve. In tension the sleeve experienced a maximum stress of 2.146 MPa (Figure 59a); whereas, max stress in NBDL was 5.163 MPa (Figure 59b,c). The relatively small stress loads in the simulations were below the theoretical tensile load of 19.69 MPa, suggesting that the failure of the model in tension and NBDL will not take place. Thus, we would expect the durability of the model to be able to sustain experimental loads from the finite element analysis.
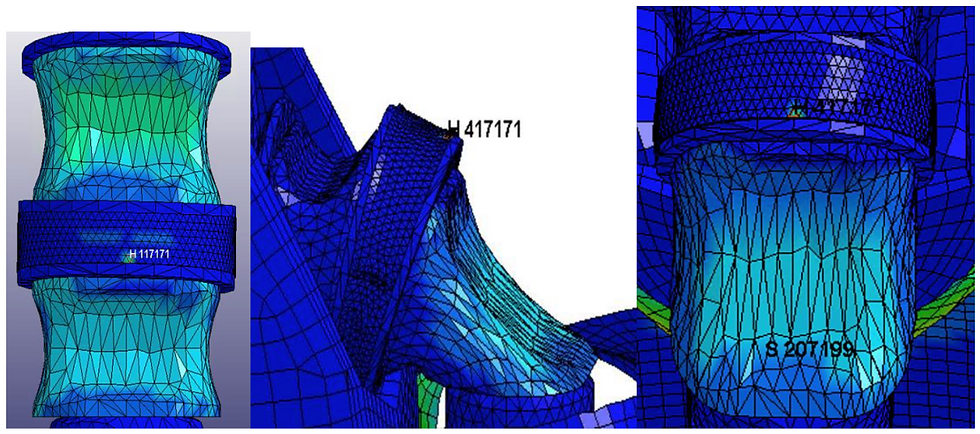
Figure 59a-c. Von Mises stress locations in tension and NBDL.
Standards and Regulation Analysis
Our main regulatory concerns will be to meet the federal requirements for the performance and model behavior of a crash dummy neck stated in the Federal Motor Vehicle Safety Standard (FMVSS) as well as the standard for child restraint systems (no. 213) found in the Code of Federal Regulations (1999). In addition, the Canadian Motor Vehicle Safety Standards (CMVSS) provides crash test dummy guidelines in hopes of reducing the number of motor vehicle deaths as well as the severity of injuries associated; this is accomplished by specifying the motor vehicle crash in terms of forces and accelerations and by specifying equipment requirements for active and passive restraint systems.
Ethical and Professional Responsibilities in the Context of Design
The ability to produce an updated cervical spine for a pediatric ATD has the potential to radically influence several industries to adjust to updated parameters for occupant safety in car crashes. If a new design were implemented with updated injury criteria that was indeed more biofidelic, this may indicate that many current cars, car seats, and restraint systems on the market are not safe. Such a discovery would have an immediate economic impact in capital necessary to make vehicles safer for children, specifically in frontal impacts, but it remains to be seen how this may influence other impacts as our team did not focus on any other condition.
Additionally, to the idea that our neck design truly be biofidelic of a 50th percentile 6-year-old, it is certainly valuable to obtain more cadaveric data to implement in corridor development. This comes with extremely high ethical concerns as a grieving family makes a generous donation to the field of research in order to help meet this global need. This is also an exceedingly rare occurrence, which adds to the value of cadaveric data. That said, many of our existing cadaveric data was either built off of animal scaling or adult scaled data as these have been more readily available. If a successful animal model was created, then a live-specimen animal testing could be performed and correlated to human injury risk modeling without the need for a cadaveric 6-year-old specimen. The usage of live animal specimens introduces its own ethical concerns surrounding health and pain management of said animal, especially in situations involving awareness/reaction to an impact event; this includes environmental concerns with the continued warranted usage of animal testing and/or the ability to utilize specimen for additional research beyond simply frontal impact car crash simulations.
Overall, society would benefit in the long term from better performing ATD’s with respect to modeling human biomechanical response; however, the continued research developments necessary require great economic sacrifice to properly support the research and its implications/applying the conclusions. The global benefit may come from a unified standard on ATD design, in which the dummies are used globally rather than different countries using different standards.
Many people unfamiliar with injury biomechanics may be shocked and appalled by the developments made within the field without recognizing their scientific significance because of the usage of both live and deceased tissue, and it is important to understand the knowledge gap in general society regarding this work. Ultimately, the sociocultural sacrifices made by families who donate their kin’s remains to science cannot be underestimated and further development of accurate and precise biomechanical response crash ATDs could benefit greatly from additional data in pediatric loading, not specific to the cervical spine.
Project Notes
Methods of Organization/Communication:
Box (shared documents)
Slack (communication)
Trello (Kanban organization board)
Software/Tools:
OnShape (CAD design/printing)
LS-PrePost & LS-DYNA (FEA)
McMaster-Carr (hardware catalog)
Skills:
Computer Aided Design (CAD)
Finite Element Analysis (FEA)